I’m sick of reading it. The number of indicators “at levels not seen since 2007” is piling up fast. Some are all-time records. While others are “at levels not seen since 2000.”
Just about all the measures signal we’re in for a crash. In just about everything. Except for one asset class. More on that opportunity below.
But first, do warning signs necessarily mean you need to take cover? How do you distinguish between somebody pushing the wrong button in Hawaii and a financial indicator telling you to sell out?
In other words, which warnings do you take seriously?
First, let’s take a look at the latest indicators flashing red. Then we’ll review the problems with warnings like these. That’ll leave you grumpy about the lack of definitive answers on what you should do. So we’ll turn to an opportunity at the end.
More warning signs of a crash
You can add options pricing to the list of indicators flashing red. Options factor in volatility and the probability of various outcomes. That makes them useful indicators of the future as well as investment tools.
The indicator flashing red in options markets is the price of put options relative to call options. American put options are cheaper relative to call options than they were in 2007. This means punting on stocks going up has never been more popular relative to betting they’ll go down. Put differently, people don’t expect a fall in stocks. They expect them to rise. And they’re most confident since 2007.
By fiddling with the options pricing formula, you can calculate the implied probability of a stockmarket drop. That sounds odd, so let me rephrase. Given the price of options, the probability of a 2% drop in the stockmarket in the next month is below 10%. The previous lows were about 15%.
If you’re confused, just think about options as insurance. It’s cheap to buy insurance against theft in Japan. Because the crime rate is low. In the same way, if it’s cheap to buy theft insurance at your home, you can thereby deduce the crime rate is low in your area. Natural disaster insurance in Japan… well, you get the idea.
Options are similar to insurance. People buy them to protect from a crash, or to profit from a rise. Options pricing is telling you the level of optimism and the lack of fear are at alarming levels. Levels they tend to be at before a crash.
But it’s not just options that are warning you.
The CBOE Volatility Index (VIX) hit all-time lows two weeks ago. It then spiked to one-month highs yesterday in the US as the stockmarket tumbled late in the day. But that was after the Dow Jones Industrial Average posted the fastest 1,000-point gain in history. Both the low in the VIX and the surge in stocks made a correction more likely. They’re further indicators of a coming crash.
By the way, the mess in the bond market, which I’ve been covering in Capital & Conflict, has done next to nothing for record low volatility in US Treasury bonds. A return to normal levels of volatility is likely to come alongside a crash there too.
There are more obscure records being hit. The number of applicants per job is at record highs in Japan just ten years after hitting a record low. If inflation breaks out in the land of deflation, Japan’s bond market could be riled.
Global initial public offerings (IPOs) hit highs not seen since the 2008 crisis. That’s a bearish indicator because companies like to raise money when their stocks are expensive. It dilutes their existing shareholders less.
Then there’s the highs in stockmarket valuations. Expert Tim Price has been warning about the dangers of those here. The last two times we reached these levels of valuation, stocks tumbled.
Just as you can deduce the probability of a stockmarket crash from options prices, you can deduce the expected return of the stockmarket from valuations.
If you buy a new car at a 10% discount and try to sell it a year later because your publisher wants you to move to London, you know the usual 19% drop in the value of a new car becomes far less of a tumble. You can deduce about 9% losses instead of 19%.
In much the same way, buying stocks cheaply improves your return. If you buy stocks when they’re overvalued, you’re booking in a loss. At least for a while, given stocks supposedly go up in the long run.
The proof is in the pudding. If you bought UK stocks in 2000, when they were extraordinarily overvalued, you’d only just have broken even.
Using such analysis, portfolio manager Dylan Grice explained the current forecast for stocks at a recent Societe Generale conference. He said the Shiller CAPE valuation model, also used by Tim Price above, implies a 2% loss in US stocks over the next decade, after inflation. It’s not as bad as buying a new car, but 2% losses over ten years doesn’t paint a pretty picture for the stockmarket.
But ten years is a long time. And 2% is just the expected outcome. Historically, the same sort of forecast delivered up to 8% gains instead. -2% is just the implied return you’re accepting by buying now.
The rub is in the nature of comparative returns. Sure, stocks might deliver pitiful returns over ten years. But bonds look just as bad if not worse.
And I think I know what Grice has his eye on instead of these two. We’ll get to that in a moment.
The real problem with all these crises indicators is that they tell you nothing about what could happen during those ten years. We could see stocks surge for five more years before they crash. By the time it happens, you’ll be sick of the warnings and go all in on the stockmarket.
Instead of avoiding overvalued asset classes, reverse your thinking. Invest in the best possible investment at any given time. The one with the cheapest valuations.
Right now, that’s commodities.
A new bull market in gold
Which asset class performed best between 2002 and 2007 – stocks or gold?
Given gold is priced in dollars, it’s the American stockmarket you have to compare it to. Otherwise exchange rates mess up your comparison.
During that time (and right up to 2012) gold and silver outperformed stocks.
This is not what you expect. Inflation was under control, interest rates rose and stocks were in a decent bull market. And yet, precious metals trounced big business’s value creation:
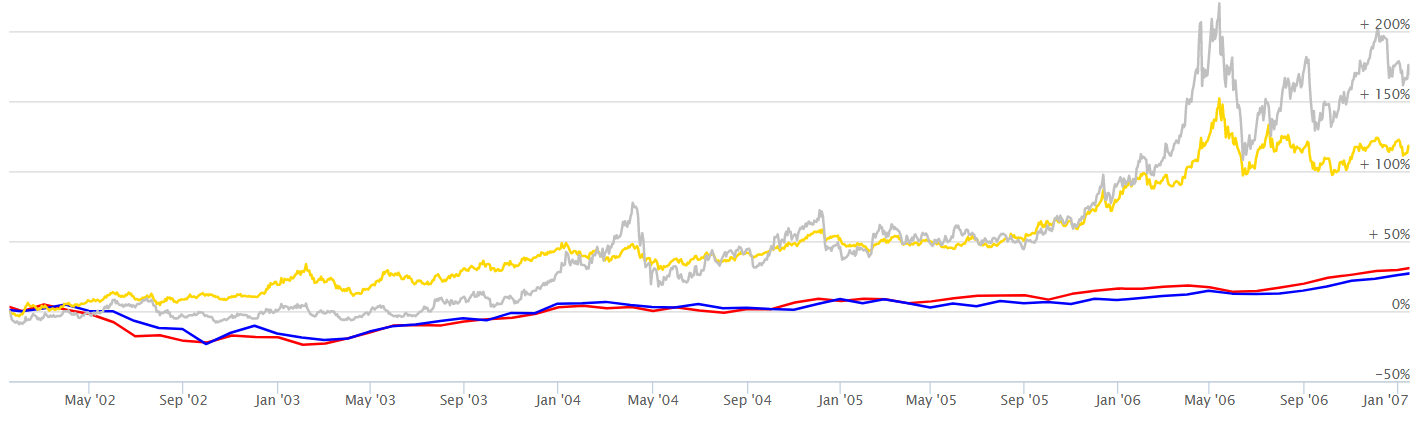 Source: Longtermtrends.net
The gold and silver price are in their respective colours and the two main US stockmarket indices are in red and blue. The chart shows from 2002 to 2007.
Since 2012, stocks have caught up while the gold and silver price slid. But the point is that, for about a decade, gold outperformed stocks. Gold really can be that powerful an investment, despite being nothing more than a lump of metal.
The thing to realise is what sort of environment gold rose in during this time. Because those conditions are about to repeat. This chart from Bloomberg shows how the gold price spiked on each interest rate increase in the last few years.
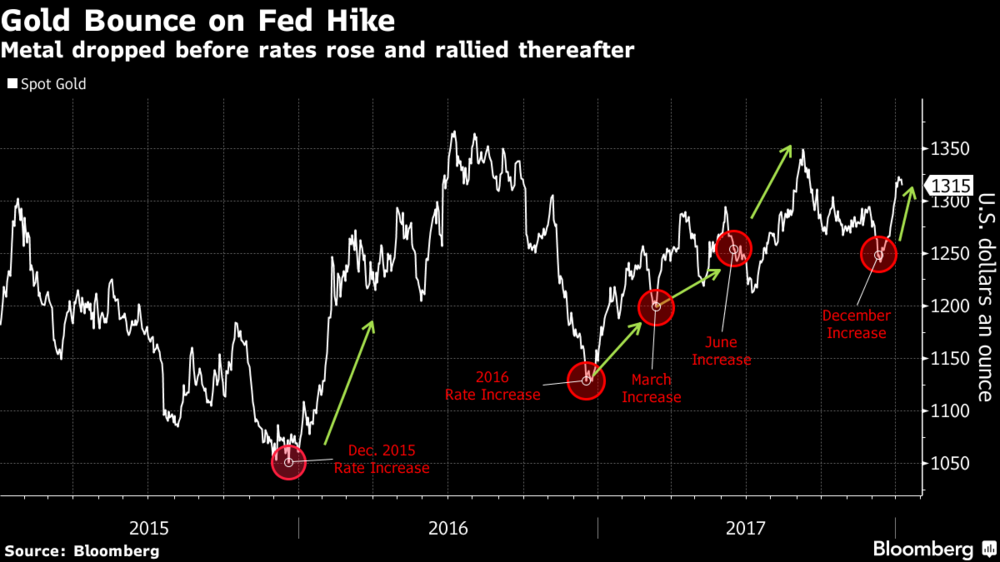
Once again, gold is outperforming during a low inflation, interest rate hiking cycle. This suggests the gold bull market has the grounding it needs to go higher.
But British investors will need patience
The caveat for British gold investors is the exchange rate.
If the pound follows gold higher, your gains will be nullified. It’s only when gold and the exchange rate both move in your favour that you really benefit. But when they do, they do it dramatically.
The 2000-2010 performance of gold highlights this. Gold in terms of pounds missed out on the early gains of the US dollar price of gold shown above. Until the financial crisis exposed itself and the gold price surged while the pound fell. That lit a fire under the pound gold price from £400 to £1,100.
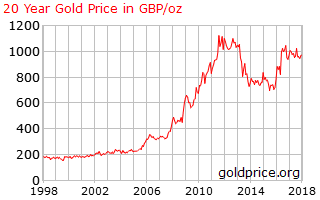
So even if the bull market in gold begins now, you may need to be patient to bank the gains.
Gold stocks and currency hedged exchange-traded funds can take the exchange rate risk out of the equation. They could be the right way to go.
Until next time,
Nick Hubble
Capital & Conflict
Related Articles:
- 9 GOLD Stocks that you should BUY now
- A bull market in interest rates is a bear market for you
- A 50% melt-up or meltdown in stocks?
Category: Investing in Gold