The stockmarket is a cyclical thing. Sometimes it goes up, sometimes it goes down.
That’s supposed to make the whole thing predictable, in a way.
If you’re at the top of the cycle, sell. If you’re at the bottom, buy. Another way to think about this is to buy when the stocks are cheap and sell when they’re expensive.
That’s the theory. Figuring out the cycle itself is harder.
It doesn’t just come down to price. You can’t judge a car only by its price. You have to adjust for its characteristics to determine its value. A £50,000 Renault is expensive while a Porsche would be cheap. Depending on what you find under the hood, that is.
The same sort of thinking applies to stocks. You have to think in relative terms. There are plenty of considerations.
Valuations like price/earnings (P/E) ratios, comparative prices such as the value of commodities relative to stocks, and many other mechanisms can be used to measure cyclicality.
Never mind how they work. Today we ask what those measures are telling us about the stockmarket.
Where are we now in the stockmarket cycle? Are stocks cheap or expensive? Should you buy or sell?
Most commentators agree that stocks are expensive. It’s the end of the cycle.
The list of reasons are long. Which makes it more persuasive. It adds evidence to the case.
We haven’t had a recession for a concerningly long time. Stockmarkets are expensive by most measures. Central banks are on a tightening path.
So stocks will fall? It’s not so simple.
This time may be different
There are some issues with the cyclicality idea at the moment. For example, some brand-new factors have entered the fray.
We’ve never had central bankers around the world pumping digital money into the system at a rate of trillions. Especially not without any sort of limit or restriction imposed by gold or law. Can markets really go down if central bankers are determined to keep them up?
We’ve never had the sort of demographic decline the Western world faces. The number of people of investment buying age is falling relative to the number of retirees who are selling their investments. More people are leaving financial markets than entering them.
Can financial markets afford being turned into giant pension schemes? Or will they wither like government budgets under the weight of pension like promises?
But let’s ignore these factors we’ve never had before. Assume the stockmarket really can shrug them off and remain in a cycle. The question then becomes, when will the cycle turn?
Overvaluation and the top
Citigroup’s chief economist Willem Buiter provides the executive summary:
“There are clearly signs of late-cycle froth in financial markets, in everything from equities, to corporate credit, and real estate, especially in the US. There is the risk of an overdue correction.
“We are reluctant to call an end to the bull-market in risk assets just yet but a considerable degree of caution is now warranted. Downside risks are rising as the business cycle matures.”
What are the signs of late-cycle froth?
There are some anecdotal ones. The S&P 500 is approaching the record amount of days without a 5% correction, for example.
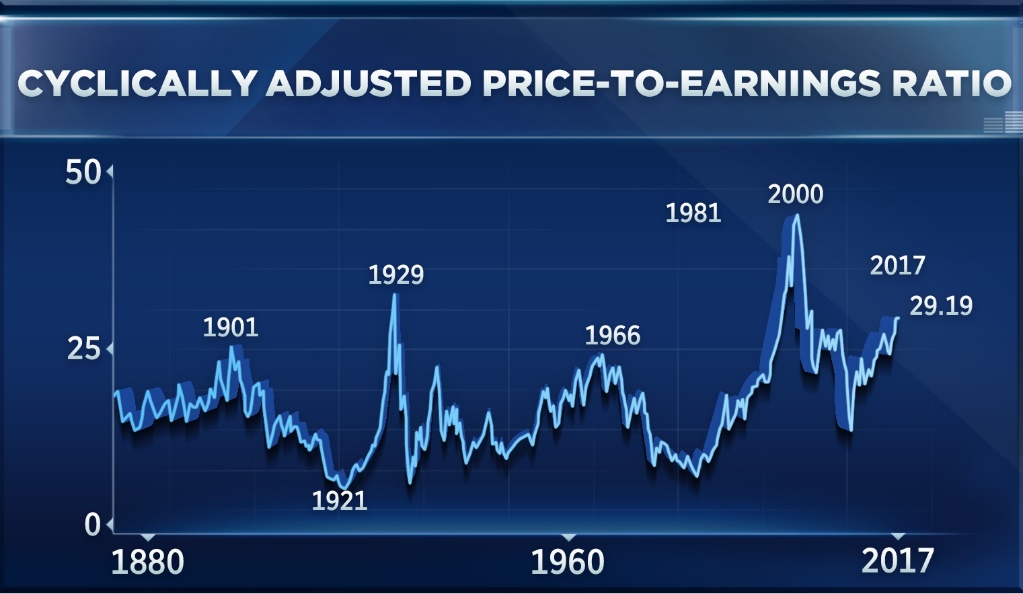
But there are more enlightened indicators too. The chart below shows a version of the P/E ratio which values the stockmarket. It tells you how much investors are willing to pay for company profits. When the cyclically adjusted price-to-earnings (CAPE) ratio is high, investors are paying a lot of money for stocks – they’re expensive.
As the CAPE ratio’s creator explained on CNBC, stocks have only been more expensive during the tech bubble and just before the Great Depression. That’s a phrase you’ll hear a lot when people talk about the stockmarket at the moment.
 Source: CNBC
While that sounds ominous, take a look at how much more overvalued stocks can become. And that’s in a world without tsunamis of quantitative easing (QE). More on that in a moment.
The real expert when it comes to valuation of the stockmarket is John Hussman. He followed valuation metrics carefully to predict the 2000 crash. Last year he declared this “the most broadly overvalued moment in market history.”
Hussman argues that a balanced view of the various ways you can value stockmarkets implies they will perform poorly over the next ten years. And that implies a crash.
But does this sort of thinking really work? Here’s a quote from Hussman in March of 2000: “Over time, price/revenue ratios come back in line. Currently, that would require an 83% plunge in tech stocks.”
Back then the 83% plunge in tech stocks predicted based on valuation metrics proved rather accurate:
Recall that following that peak, the S&P 500 did indeed lose half of its value, the Nasdaq Composite lost 80% of its value, and the tech-heavy Nasdaq 100 Index lost an oddly precise 83% of its value.
Oddly precise is good enough for me.
We’re in frighteningly similar circumstances today. Focusing on the valuation measures that proved valuable in the past, you get much the same conclusion today as in 2000:
… the consensus of the most reliable equity market valuation measures we identify (those most tightly correlated with actual subsequent S&P 500 total returns in market cycles across history) advanced within 5% of the extreme registered in March 2000.
Not much more and we’re in uncharted territory.
Valuations aren’t everything
If it weren’t for central bank meddling, I’d agree with Hussman. Stocks are due for a plunge.
But one financial market commentator has broken ranks when it comes to this well-reasoned pessimism. And his prediction is precisely the opposite to Hussman’s.
Jeremy Grantham is one of the most experienced and wise investors out there. He’s probably been burned by predicting a bear market because of overvaluations one too many times. So this time he is expressing the same doubly cynical view I did during the War On You conference last year.
If we can agree that stocks are overvalued and in a bubble, then clearly valuations and prices aren’t the key driver at this point. If overvaluation was enough to tip stocks over the edge, then overvaluation wouldn’t really have happened to begin with.
Here’s how Grantham explains it:
Extreme overvaluation plays a huge role in bubbles breaking: It is a necessary precondition. The more overvalued, the merrier. But, for judging the extent that bubbles will overrun fair value and for timing the break, value, sadly, is largely irrelevant. Thus, it is a necessary but absolutely not sufficient condition.
So if stretched valuations are merely a precondition and not yet a warning sign, what pushes bubbles beyond overvaluation? Something else must be at work for overvaluations to grow to absurd levels. But what is it?
Euphoria? Animal spirits? The musical chair phenomenon that Chuck Prince blamed? “As long as the music is playing, you’ve got to get up and dance” he told Congress to explain the lack of caution at his firm in 2007.
These are pitiful explanations because they don’t explain something called a cluster of errors. People are always greedy and fearful. For a pack to gain momentum in one direction, there has to be a stimulus. Something that makes them all buy or sell regardless of valuation.
Perhaps it’s the belief in bailouts should things go wrong. Or that interest rates will fall if there’s any sign of trouble. Central bankers will manage the bull market indefinitely, they tell themselves. Perhaps correctly this time.
Whatever the motivation that’s fuelling a bubble, it’s this motivation that you have to watch to predict the bubble bursting. Valuations have been left in the dust.
Signs a bubble will burst
Instead of watching valuations to predict a crash, Grantham considers them a binary variable. If stocks are very overvalued, it’s a bubble. But how overvalued they might be doesn’t help you at this point.
Instead, Grantham argues, look for other signs.
One reliable indicator is something called a melt-up or blow-off rally. When prices go bananas. They almost always do at the end of a bubble, just before it pops. And we haven’t really had one yet.
That’s why Grantham finds himself torn between the valuations he believes rule the market and the missing blow-off rally. In his note to clients, he’s made the call. There will be a melt-up before there’s a meltdown. A 50% rally in the US stockmarket is in the cards. Before an impressive bloodbath.
Another feature most bubbles have in common is a three-year lifespan. The Japanese bubble, the tech bubble, the 1920s bubble that led to the Great Depression and the US housing bubble all lasted about three years (including the crash). That means the blow-off rally has plenty of time to run once it begins.
Last but not least, recent academic research into bubbles suggests the common denominator is acceleration in the price growth. That parabolic shape you see in price charts features before a crash. Which we haven’t seen in the stockmarket. Yet.
So where are we now? Grantham calls it Base Camp. It’s the point from which the melt-up or blow-off rally begins.
If you apply the above bubble features to the S&P 500, then we’d need a 50% rally before you need to be scared. Grantham illustrated his prediction:
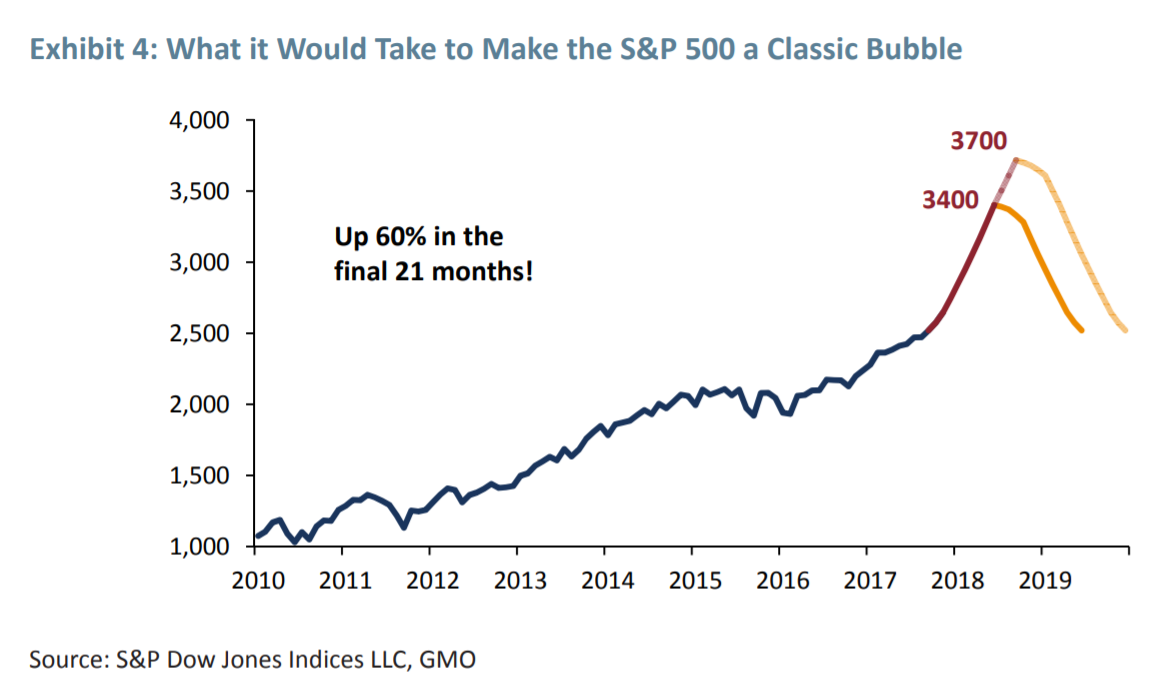
And yes, that sounds absurd at already stretched valuations. But who cares when 50% gains are on offer?
Until next time,
Nick Hubble
Capital & Conflict
Category: Central Banks