Maybe it’s my inner Malthus, but I think there’s something to the idea of ‘peak oil’ – the theory that we have already used more than half the world’s oil reserves and that supply is in decline.
But I don’t know how much oil there is under the oceans, under the Alaskan, Arctic or Siberian ice, or under the sands of the Middle East. I don’t know what some despot in some oil-rich nation is about to do, nor what overseas military intervention is or isn’t about to take place.
I don’t know how much money central banks are going to print, how much inflation or deflation there is in the pipeline, nor how much it will affect oil futures speculation. Nobody does.
This is one of the problems I have with analysing the fundamentals for a market like oil. You could spend your whole life studying oil and nothing else, and still not know everything there is to know about what could affect supply and demand.
That’s why I prefer to base my strategy around price action. And that’s what I want to look at today.
What’s next for the oil price?
Oil – in this case West Texas Intermediate (WTIC) – is a market I have been lucky enough to call well over the last few months. Back in June, with WTIC at $97 a barrel, I suggested the price was getting set for a move up to the $105, $110 and possibly $115 area. [ It’s a call I got right – $112 was the high – but I had no idea that the US and UK governments were about to try and get involved in a war in Syria.
In September, with oil at $107, I suggested we were getting set for a fall to the mid-$90s. This is another call I was lucky enough to get right. It’s now at $96. I could see a good deal of fear and speculation over Syria in the price, but I didn’t know that said military intervention was about to be called off.
I based both calls on nothing more than price action. I felt oil was getting set for a run and then I could see there was resistance in the $110-$115 area.
So what do I make of the current price action?
Every year since 2009 oil has been making higher lows. Around $35 in 2009, $67 and then $70 in 2010. In 2011, it was $76. In 2012, $77 and $84. So far in 2013, the low has been $86.
The longer-term trend is definitely rising, though gradually so. And for now I remain bullish over the longer-term.
Over the last three years oil has traded in a range, capped at the $110-$115 area with a base in the $75-$76 area. I’ve illustrated that range in this chart below, which shows oil since its 2009 lows. My $110-£115 target was based on that red band of resistance and nothing more.
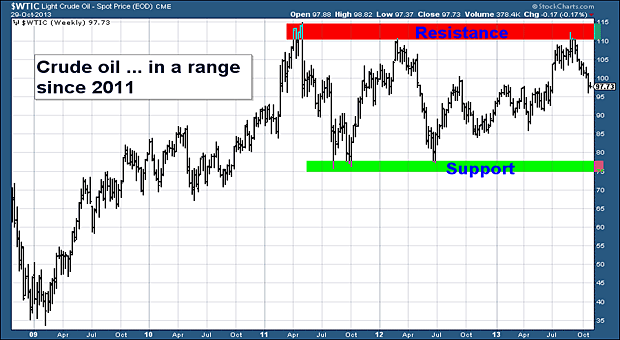
Source: StockCharts.com
Now at $97 we’re right in the middle of that range. But the price is falling. Are we headed to that green band in the $75-$78 area?
It’s possible, of course. But I doubt it.
Here’s why. Ignoring the summer spike over Syria, over the past year or so, oil’s range has narrowed. The top of the range has been the $96-$98 area. The bottom has actually moved up to the $84-$86 area. In the chart below, which shows oil over the last 18 months, the red band marks the top of the range and the green the bottom.
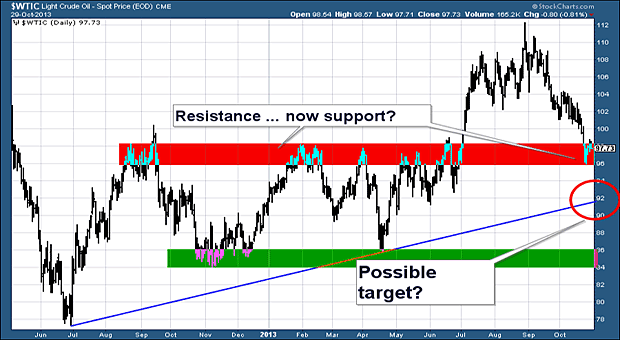
Source: StockCharts.com
It would take some big news, I suggest, to take us below this range and back to the $75 area. A sudden increase in supply due to a discovery of new oil fields, perhaps. Or an economic slump that markedly decreased consumption. Or the rapid take-up of some new technology that replaces fossil fuels.
All possible, but unlikely in my view.
All the same, from its summer highs of $112, oil is now in a downtrend. The question is where will it end? We may have already seen the low. That red band in the chart above at $96-$98 may prove to be support.
Another possibility is that we head lower to that blue trend line where I have drawn the circle at $92. And a further possibility is that we go back as far as that green band in the $86 area.
Overall, my gut feeling is that we are headed to $92, and possibly $86. But I don’t have a great deal of conviction in this. So while I remain short (I’m betting the market will fall further), I have moved my stop-loss to $100, so as not to give back too many of my gains in the not improbable event that I’m wrong and oil rallies.
And if we do get further falls, and we head towards $92 and $86, I’ll keep on moving my stop lower, so as not to give back gains in the event the market turns.
The point of charting
I know I harp on about it, but good money management, particularly when it comes to risk, is by far the most important attribute an investor can have. Yes, it’s a great feeling when you call a market right, but nobody has a 100% record, not Warren Buffett, not George Soros, not Carl Icahn, no one. Those guys probably don’t even have a 60 or 70% hit rate on their calls, yet they are all much richer than you or me. Far more important than getting your calls right, is how you manage your losers when you don’t.
I’ve seen portfolios where those in charge have got way more than 50% of their calls right. But poor money management, particularly in the trades that went against them, have decimated the overall portfolio performance. They let their losers, rather than their winners run.
This is the point of charts, for me. Many feel it’s hocus pocus, but charts help me consider a plan before a trade – where will I get in, where will I take profits, and, as importantly, where will I decide my view is wrong, and exit. Until somebody can show me another system that works better for me, I’m going to stick with the charts.
If you’re interested in finding out more about trading, by the way, sign up for my colleague John Burford’s free email, MoneyWeek Trader.
Category: Market updates