The price of oil is, perhaps, the single most important price in the world. The cost of almost everything we do at home, at work and at play is affected by it.
Cheap oil made much of the economic growth and progress of the 20th century possible.
If the cost of oil is high, the cost of food goes up, the cost of manufacturing goes up, and the cost of transportation goes up. That leaves us with less to spend on everything else – whether it’s food, accommodation, goods and services, or investment.
A rising oil price also tends to mean rising inflation, which puts pressure on interest rates to rise as well. So the last thing policy-makers need right now is a high oil price.
But they’d better brace themselves. That could be just what’s coming.
The oil price is warming up for a major move
Oil appears to have dropped off the radar somewhat over the last couple of years.
In the volatility of 2007-08, the words ‘Peak Oil’ were on everybody’s lips and the price of light crude (the West Texas Intermediate – WTI ¬– benchmark) went all the way from $50 up to $147 then back down to $35 a barrel. There was then a two-year bull market, which began in the spring of 2009 at $33 and ended in the spring of 2011 at $115.
Since then light crude has been fairly settled. Over the last two years, it has been making a series of higher lows: $75, then $77, then $84, then $85 last month. But at the same time the highs have been getting lower: $115, then $110, then $100, then $97. In other words, its trading range has been getting narrower and narrower. And it’s discreetly crept off the headlines.
A long period of consolidation – such as this – can portend a sustained move. As the saying goes, ‘The bigger the base, the higher in space’.
Here’s a chart showing oil over the last seven years. The narrowing trading range that I am speaking about is quite clear.
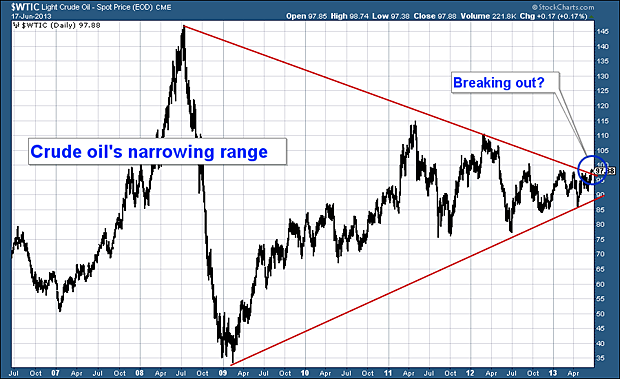
And as you can see, the price has just moved above the red falling trend line, so there is a hint that it is ‘breaking out’. For now, I don’t think this is too significant. It’s largely a function of the US dollar weakness we have seen over the last month.
And I wouldn’t be at all surprised to see oil fall back to $95 or so within the next few days – back within those two red lines. But I do see this long-term base we are building as very significant.
The best ways to bet on the oil price
Let’s zoom in now and look at a shorter-term chart, taken over the past year. As well as the price of WTI (in black), I have drawn three moving averages. The way these averages are aligned has got me excited.
The red line shows the 252-day moving average (252 dma – the average price of the last 252 days). I use this because there are around 252 trading days in a year. The amber line shows the 55 dma. And the green line shows the 21 dma.
When a sustained uptrend is in place, you would expect to see the price above all three dma lines, and with all of the lines sloping upwards. As you can see from the chart, that’s how oil is aligned now.
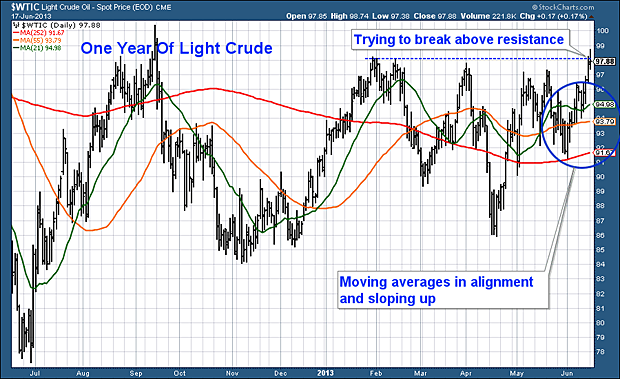
The committed chart-reader might even be able to detect an inverted head-and-shoulders pattern, which would be another sign that a low is in place.
You can see oil is just trying to break above that line of resistance at $97, where I have drawn the dotted blue line. It might not get through on this occasion, but a pullback to around $95 would mean a further bunching of those moving averages, which, from a technical point of view, looks even better.
If I’m right and we are getting set for a move, the base it is coming of is high. From the mid $90s a run to $105, then $110 and even $115 really isn’t such a big deal – a 10 to 20% move. As I have said before, trends are very powerful things, which can continue for longer than people expect. If oil moves steadily to $110 or $115, we’ll have a nice trend in place, and that could be enough to push us over $115 after a couple of attempts. Once $115 is passed, the 2008 highs of $147 come into the frame.
Think about the implications for a second: this wouldn’t be some mad speculative run as in 2008, rather it would be a run built on a market whose foundations at higher prices are very much set. Take $75 oil, for example – we haven’t seen $75 oil since summer 2010. I’m wondering if we’ll ever see it again.
I could be completely wrong about this set-up, of course. These patterns don’t always work – I spotted a similar one in the sterling-gold chart last autumn which didn’t work out. This why I always recommend the use of stop-losses to limit risk. I’m considering a buy order at $95 with a tight stop at $93.
There are many ways to play the light crude price. You can spread bet or use contracts for difference (if you are interested in spread betting, sign up for my colleague John Burford’s free MoneyWeek Trader email). Another easy method is via a London-listed exchange-traded product from ETF Securities which goes by the unfortunate stock ticker, CRUD. I tend to favour spreadbetting commodities for sheer simplicity, but always remember you can lose a lot more than your initial stake, so manage your risk carefully.
What a surge in oil prices would mean for your money
If we do get a sustained rise in the oil price, it’ll be another nail in the coffin of the already-struggling bond market, because it pushes up inflation, while dragging down growth. Everything gets more expensive for users of oil (just about everyone, directly or indirectly) and because more money is spent on energy costs, there’s less available for anything else, which hits growth.
When costs rise but wages do not, you often get political unrest. Policy-makers then have a choice to make between tolerating inflation – which makes them unpopular – and higher interest rates, which also make them unpopular. It’s a vicious cycle.
In his book The Big Flatline: Oil and the No-Growth Economy, economist Jeff Rubin notes that: “From 2004 to 2006, US energy inflation ran at 35%… In turn, overall inflation… accelerated from 1% to almost 6% [as measured by the consumer prices index]. What happened next was a fivefold bump in interest rates that devastated the massively leveraged US housing market. Higher rates popped the speculative housing bubble, which brought down the global economy.”
In other words, the high oil price led to rising rates, which exposed, as Warren Buffet might put it, who was swimming naked. Could it happen again? We may soon find out. I’m predicting $115 oil before year-end. And if we get to that, 2014 could be another year of $147 light crude.
Our recommended articles for today
MoneyWeek TV: Have central bankers lost control?
Merryn Somerset Webb and John Stepek are joined in the studio by bestselling author David Stockman to discuss the disaster that is central-bank money-printing, and how investors can protect themselves.
Don’t write off emerging markets just yet
A slowing rate of growth in developing economies can sometimes be a bullish signal for investors in emerging-market stocks. Merryn Somerset Webb explains why.
Category: Market updates