Back in June, with the oil price (as measured by the West Texas Intermediate benchmark) in the mid-$90s per barrel, I suggested we were getting set for a move to $110.
Last week – as fears grew that military intervention in Syria looked a done deal – the price hit $112.
Since then, intervention has encountered a few obstacles, and the price has slipped back to $108.
We made my $110 target. I moved my stop-loss to $109 a barrel when it hit $112, and I’ve now been stopped out.
So what I’m thinking now is – what’s next for the oil price? And how can you profit?
The single biggest threat to the global economic recovery
The biggest threat to the global economic recovery right now is not military intervention in Syria, nor is it chaos in the emerging markets. It’s not even the latest episode in the US debt ceiling drama.
It’s interest rates.
Rapidly rising interest rates will batter the recovering housing markets of the UK and US. They will lift the cost of borrowing for businesses, and thus their profit margins, and their ability to hire, to spend, and indeed stay solvent. Perhaps most of all, they will affect the ability of governments to run their terrifying deficits.
The last thing an economy built on debt wants is rising interest rates.
That’s one good reason to keep an eye on the oil price. As the price of oil has gone up over the summer, so interest rates (as measured by government borrowing costs) have risen too. The two are closely related.
That’s because the price of oil – the most important commodity in the world – affects everyone. If the price is rising, it makes life more expensive for both companies and consumers. That means lower profits and less spending. It also means higher inflation, which in turn puts pressure on rates to rise – which further affects costs and profit margins. It’s a vicious circle.
The bad news on that front is that the oil price doesn’t look like collapsing any time soon.
Looking at a five-year chart of oil, you can see a gradual process of higher and higher lows each year. In 2010, we saw lows of $67 and $70. In 2011, it was $76. In 2012, $77 and $84. So far in 2013, the low has been $86.
Back in June, I suggested that we would never see $75 oil again. Barring a 2008-style deflationary bust, this is the call I am sticking with.
These increasingly higher lows indicate a rising trend. And trends are powerful things. They can go on for much longer and to far higher levels than most people expect.
Why the oil price looks likely to dip in the short term
However, at the other end of oil’s trading range – at the highs – there is considerable resistance in the $110-$115 area (indicated by the red bar on the chart below).
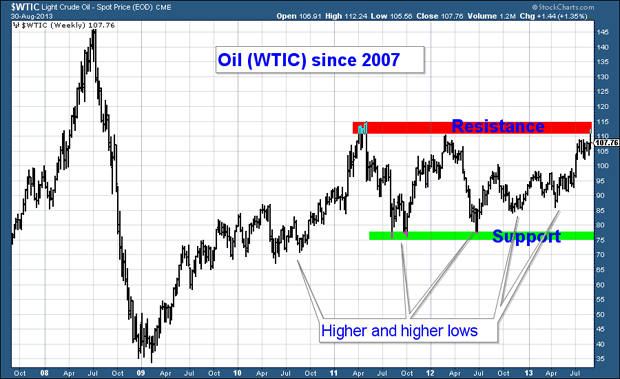
Source: StockCharts.com
$115 was the high for 2011. $110 for 2012. $112 – last week – has so far been the high for this year. The more often that high gets retested, the less likely it is to hold. But for now it is a barrier.
That surge in 2011 to $115 came alongside the high in general commodities. But it also followed the Wikileaks revelation that Saudi Arabia had overstated its oil reserves by 40% – which gave credence to the ‘Peak Oil’ theory that global oil supplies are diminishing.
Interestingly, these revelations resurfaced again over the last fortnight. And of course, ‘Peak Oil’ hype also had a lot to do with 2008 oil blow-off to $147.
The implication is that a fair few dollars in that $112 a barrel price tag last week were just hype, and so unsustainable, at least for now. And in both 2011 and 2012, the oil price failed to breach that red line, and went on to fall all the way back to the high $70s.
Meanwhile, oil is overbought, and it’s trading towards the higher end of its range. So while I’m bullish on oil in the longer run, we’re probably due a fall now – that red barrier in the chart above will remain as resistance for the time being.
On the downside, I see the first line of support on any correction to be around $102. After that it’s $98. And then $92. So for now, I’m more tempted to short the WTI oil price, with a target somewhere in the mid-$90s, and a stop at $113. But whether this level comes into play or not will be determined by the decisions that get made in Washington as regards military intervention in Syria. That’s why if you’re going short, I’d keep your stop loss tight.
And if oil does fall into the mid-$90s, I’ll be looking to take profits. Because in the longer run, I am bullish. Higher prices are the result of a combination of inflationary monetary policies, falling oil supplies and constant if not increasing demand. If we can get through $115, I see very little resistance until the 2008 highs at $147.
If you want to play the light crude price, you can use a spread bet or contract for difference (CFD). There are also exchange-traded products available from ETF Securities, to play either the short or long side of the trade. I tend to favour spreadbetting commodities for sheer ease of use, but you can lose a lot more than your initial stake, so manage your risk carefully.
Category: Market updates