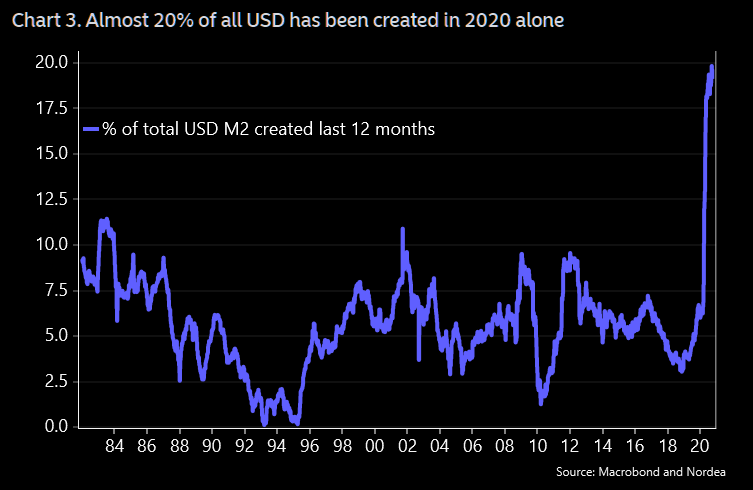
THE ARTISAN, STAFFORDSHIRE – Almost a fifth of all the US dollars in existence were created this year.
Quite an achievement, that. Considering the world’s dependency on greenbacks to do business – using pictures of Benjamin Franklin to do all the import stuff like buy commodities and record profits – you’d imagine summoning 20% more of them into existence would have a pretty big impact.
Here’s the scene of the crime:
 Source: The Market Ear
This isn’t a result of the US Treasury department deciding to print miles upon miles of $100 bills – though it’s done a fair bit of that, to be sure.
What’s being charted there is a measure of the total money supply in the US called “M2”. M2 not only includes physical cash in circulation, but the total balance of all US bank deposits and the total size of Money Market Funds (short-term investment funds which are treated like money as they only own short-duration low-risk debt).
Importantly, M2 also includes bank reserves held at the Federal Reserve. These are the bank accounts of banks like JP Morgan, which they are obliged to keep at the Fed to ensure they don’t run out of money.
When the Federal Reserve prints money to buy assets from banks (be it called “quantitative easing”, or otherwise), the freshly created money is paid into the recipient bank’s reserve account. For the Fed, it’s as simple as just adding a few zeros on a spreadsheet after the bank has agreed to sell, and the total money supply is increased.
The Fed is responsible for roughly $3 trillion in dollar creation this year, and much of that has gone into inflating bank reserves. M2 has accordingly risen from $15.34 trillion at the beginning of the year to $18.72 trillion as of last month.
This is the pile of assets the Fed has printed money to buy, in millions:
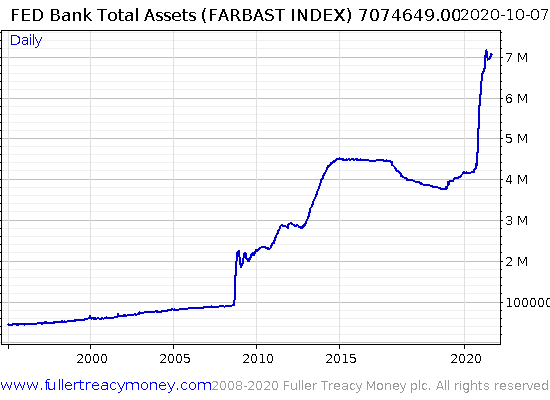
Banks can redeem those reserves at the Fed for physical banknotes. It’s just like making a withdrawal, except for an entire bank from the central bank, and they’re never allowed to empty their account. So in theory, a fair chunk of that $3 trillion could translate into more dollar bills in the world. But if this in anything like the aftermath to the financial crisis, that cash won’t make it out, and it’ll instead just stay within the financial system.
But that doesn’t mean the world doesn’t care about the dilution of currency. After all, the newly created cash is being used to swarm and crowd out interest-paying investments, in order to force interest rates down.
On Monday (Greenbacks from Greenpeace) we took a look at the boom solar energy stocks have been having this year. The TAN ETF has been blazing a trail through the sky – a signal that some commentators interpret as a the market expecting a green Joe Biden presidency.
If that’s the case, we expect the sunny sector will be very disappointed in three weeks’ time. But today, let’s take a look at a different yellow asset. Or as the Incas called it, “the tears of the sun”… gold.
I’ve posted this chart a couple times before in this letter (Saddam and Smaug: golden hoards – 5 June), but it keeps busting past new records. This is the total quantity of gold held by exchange-traded products. It’s a measure of mainstream investment interest in gold, for “true-believers” often like to keep their gold closer to home than in some asset manager’s vault. The guys buying the ETFs are short-term traders and larger investors who value gold’s investment properties rather than folks who want insurance against the world burning down.
The great global gold hoard just keeps on growing:
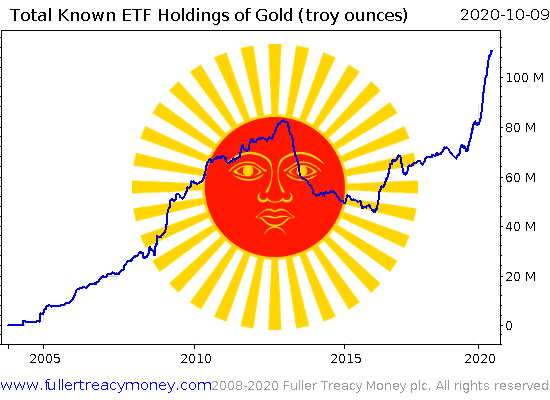
The shiny stuff is getting more popular amongst the investment crowd. But I don’t believe we’re anywhere close to how popular gold will be in the next few years.
Charlie Morris over at The Fleet Street Letter Wealth Builder shared a chart with his subscribers a while back which showed how popular gold ETFs are relative to stocks. I asked if he could update it for me for today’s letter, and he graciously accepted.
This is the value of total gold ETFs relative to the total value of stock ETFs. Note that while gold is on the up… we’re still nowhere near where we were in 2011:
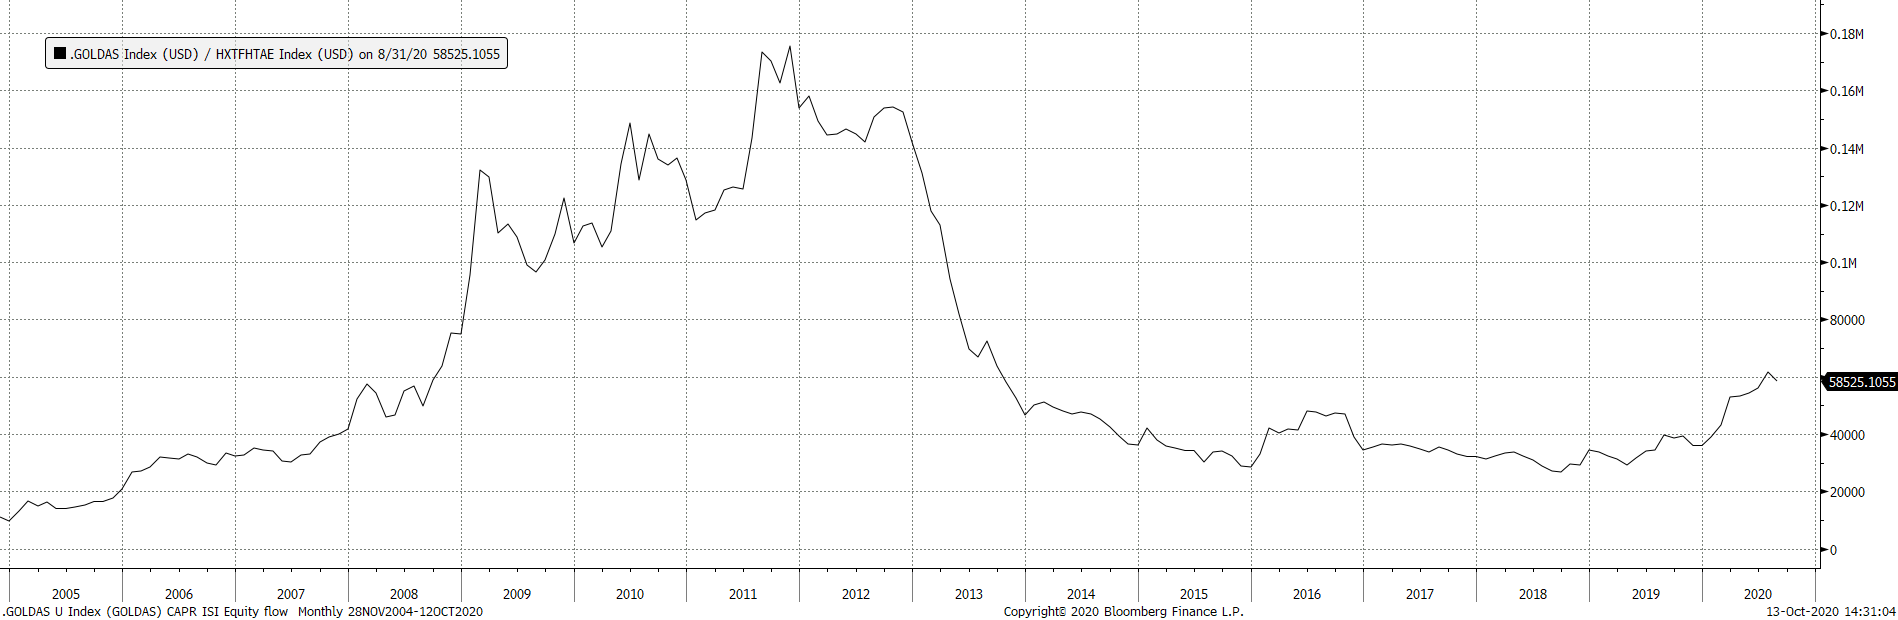 Source: Bloomberg
I reckon gold’s popularity in 2011 was just the dress rehearsal. Once this bull market in gold is done, the line on that chart’ll be an awful lot higher. The sun ain’t done crying yet…
All the best,

Boaz Shoshan
Editor, Capital & Conflict
PS I made an error in yesterday’s note, which thankfully only a couple of you seem to have noticed (or perhaps you’re all just too kind to point it out). When describing a zero-coupon bond, I gave the example of a €1 million bond bought for €999,000 and said the yield on it would be 1%. This is dumb – the yield on that would be 0.1%, as that’s $1,000 out of a million. It’s an embarrassing failure of my maths-while-writing faculties, which has since been corrected on the website.
Category: Investing in Gold