Palladium’s had quite a run.
From an August low of $520 per ounce, it’s risen by almost 40% to a high of $725 last week. That’s quite a move in less than two months. We’re at $695 today.
Let’s cut to the chase: I’m now a seller. Let me explain why.
We’ll start with some background on this not-so-well-known, silvery-white metal.
It’s deemed precious – it’s both rare and expensive – but its main uses are industrial. About 70% of annual demand comes from the motor industry, where it gets used in catalytic converters. (Right here is your explanation for its recent run – the Volkswagen scandal).
Another 23% of demand comes from industry – electronics, medicine, dentistry, medicine, fuel cells and hydrogen purification (since you ask). A little bit more than 4% goes into jewellery. Investors account for the final 1%.
If you look at the supply/demand numbers alone, it’s easy to end up as a palladium permabull. Annual demand in 2014 was 10.7 million oz, according to Johnson Matthey (the industry authority). In 2015, a lower figure of 9.4 million oz is forecast.
But annual mine supply – over 80% of which comes from either South Africa or Russia – stands between 6.1 million and 6.4 million oz. This year it will be 6.4 million. So that leaves a shortfall of about three million oz.
Most of that is met by recycling – and supply here is growing. It hit 2.5 million oz in 2013, 2.75 million oz in 2014, and 2.9 million oz this year.
Even so, there is usually a deficit, which is met by the opaque world of ‘Russian stockpiles’.
Year in, year out, the same story does the rounds. How is this supply-demand deficit going to be met? In 2014, it amounted to almost two million oz. Every year the price rallies on those fears – yet these stockpiles always seem to deliver.
Interestingly, however, this year total mine and recycling supply is set to match demand for the first time in goodness knows how long. That was before the Volkswagen story broke.
I actually recommended palladium in January 2014 and we got a nice rally through to September, and over $900.
I’m not so bullish now.
Palladium walks its own road
One thing to note about palladium is that it is very much ‘its own metal’. Most metals, whether industrial or precious, tend to trade together. Sometimes gold might outperform, sometimes copper will. But you will usually find that the general metallic tide is in some kind of sync.
Palladium is more of an outlier. It does its own thing. Between 1997 and 2001, for example, while most metals were having the last bit of life strangled out of them at the end of a 20-year bear market, palladium went from $116 an ounce to above $1,000. It wasn’t far off ten-bagger status.
In 2012-14, while most metals again were busy stinking out their owners’ portfolios, palladium was on another of its upward surges, going from the $550 area to $913.
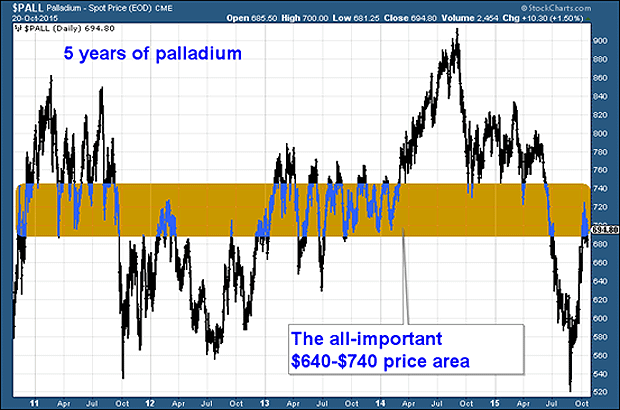
So we can safely ignore what is going on elsewhere in metals complex and focus on the palladium price action alone. Below is a five-year chart. You can see that I’ve drawn a brown band across the $680-$740 price area.
This brown region has proved to be both support and resistance. It has acted as a barrier. (Apologies for the colour by the way. I was trying for amber, with all its traffic light significance, but it’s come out a rather sickly brown instead.)
And the current rally, which began in August, has stalled in the amber zone.
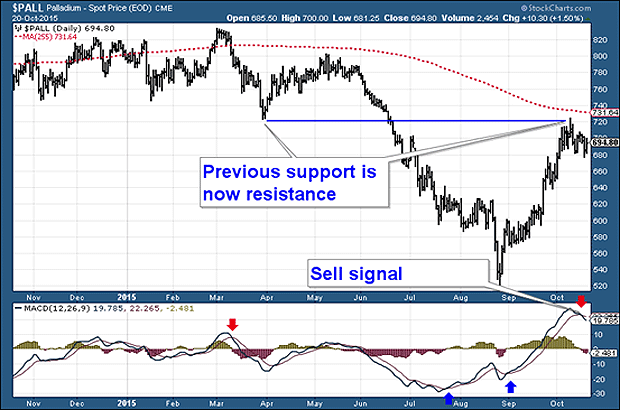
Let’s zoom in and look at the more recent price action. Here is a one-year chart.
I’d like to draw your attention to a couple of things. First, the horizontal blue line at $725. What was support in March has so far proved to be resistance.
The dotted red line, the one-year moving average, is falling (indicating the broader trend). And at $730, it adds to the resistance and the downward pressure.
However, my actual sell signal is this: a simple ‘MACD’ crossover. MACD is a simple tool for trend-following and momentum-trading. For this you need to look to the bottom of the chart.
The sell signal comes when the brown line crosses down through the black line (I have marked these with red arrows). The buy signal comes when the black line crosses up through the black line (blue arrows).
It doesn’t always work. The first buy signal in late July met with further falls – and if you’d had your stops in tight you would probably have been stopped out. The second buy signal – the blue arrow in early September worked better.
The best signals are when the crossover occurs as far away from the zero line as possible. And right now we have a beauty: a clear cross down a long way from the zero line.
I have no idea what the next phase of the VW emissions scandal is going to be, nor do I have a clue about its potential implications for palladium demand. To be frank, I haven’t done a great deal of homework on the current situation in palladium mining. This is just a simple, technical ‘sell’ signal based on price action alone.
In terms of risk management, I would place my stop either above last week’s high of $725, above the one-year moving average at $730 or above the amber zone in the first chart (ie above $740). And I wouldn’t risk more than 1% of the portfolio on the trade. (There are also exchange-traded funds available that allow you to short the palladium price).
But I think there’s a good chance that the last two months have been little more than rally in an ongoing bear-market, one that is set to resume. My first target is the $600-$620 zone. We’ll see after that.
Category: Market updates


