Today we consider the train wreck that is oil.
It just keeps falling.
Drops like this do not happen very often.
So where will it end? What happens next? And how can you profit from it?
Oil’s once-in-a-decade plunge – but when’s the rebound?
In June, the oil price (as measured by the US benchmark, West Texas Intermediate or WTI) hit its high for the year, at $108 a barrel.
Although it didn’t seem likely at the time (does it ever?), July marked the beginning of Oil Armageddon.
First it slipped below $100. It loitered in the high $90s in August. In September we saw low $90s. And then came October.
I remember writing about oil then. I thought that, because oil had been trading in a range that was getting narrower and narrower, a big move was coming. I got that bit right. The only problem was I thought it’d be up! Boy, was I wrong.
Capitulation followed capitulation. From $93 a barrel we slid to $80.
$80 seems expensive now. November came and oil just carried on tumbling. Obvious levels of support were obliterated. The price slid to $66. Ten days into December and we’re down another 5%, at $63.
Look at a long-term chart of oil and you’ll see that capitulations like this are verging on the historic – they’re almost once-in-a-decade events. Some are bigger than others, but I’ve marked them with a red arrow.
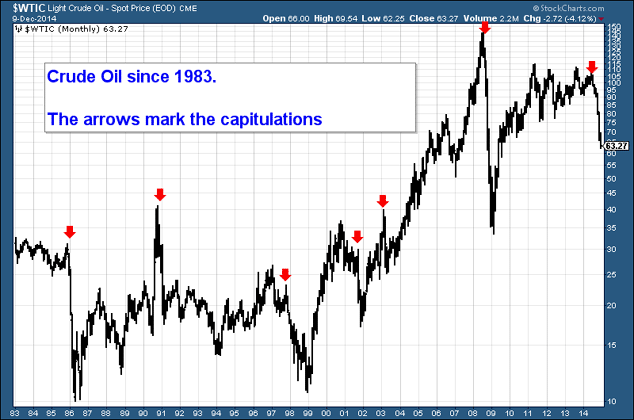
The thing to note is that, with the exception of 1991, every capitulation was followed by one heck of a rally.
Get this right and there’s money to be made.
So where’s the low? That’s the million-dollar question. And I’ll give you my view in a moment.
But let’s take a look at what’s driving oil down first.
The plunge in oil has a pretty simple explanation
There are some fantastic conspiracy theories around this oil price shock. The Americans want to hurt Russia. The Russians want to hurt the US. The Saudis want to hurt Russia and the US. And so on. Oil is a slippery business.
There’s a rather more sane explanation. Macquarie put out the graph below in its recent report, Global Oil: The good, the bad and the very ugly (where do they get their title ideas from?). The red bars are the relevant ones.
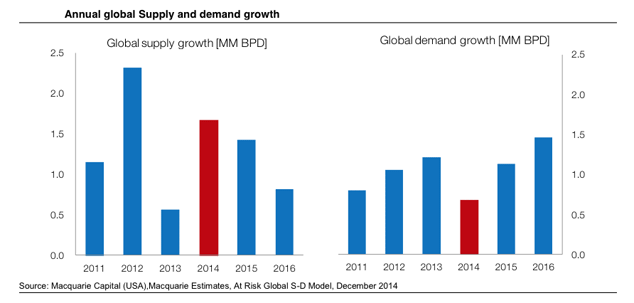
In short, this year, oil supply growth has accelerated, and demand growth has slowed. Throw in the leverage of many speculators caught on the wrong side of the market and you have a pretty rational explanation for this capitulation.
So how long can oil stay down here? The cost of producing oil divides opinion. But after doing some digging around, I’d say that $65 oil is not such a disaster for oil producers as I might once have thought. In 2013, for example, 80% of light oil production in the US had a break-even price of $60 a barrel or less, according to the International Energy Agency.
Of course, higher prices are necessary if new production is to be stimulated, and shale will struggle. But current prices will not destroy the new oil industry in the US as it currently stands.
And production costs for the 12 nations in oil cartel Opec are far lower. Yes, they rely on high oil prices to maintain government spending – only Kuwait can sustain current levels of public spending at $63 a barrel of oil. But the actual cost to them of getting oil out of the ground profitably is well below this.
This table from Reuters shows the marginal cost of production for various regions around the world.
| Regions | Dollars per barrel ($/bbl) |
|---|---|
| Arctic | 115-122 |
| Brazil Ethanol | 63-69 |
| Central and South America | 29-35 |
| Deepwater Offshore | 54-60 |
| EU Biodiesel | 106-113 |
| EU Ethanol | 98-105 |
| Middle East Onshore | 10-17 |
| North Sea | 46-53 |
| Oil Sands | 89-96 |
| Former Soviet Union Onshore | 18-25 |
| Russia Onshore | 15-21 |
| US Ethanol | 80-87 |
| US Shale Oil | 70-77 |
| WAF Offshore | 38-44 |
So, much as I was sceptical about the prospect, it does look as though the world can continue with a sub-$70 oil price for longer than most people might think.
That said, as John noted in this week’s issue of MoneyWeek magazine, capitulating oil prices could cause all sorts of problems elsewhere. For example, energy accounts for around 16% of the junk bond market. Oil at $60 presents the very real risk of mass default, with a knock-on to the rest of the high yield market. Energy companies also make up a large portion of the stockmarket. If they start losing real money, the underlying health of the broader market deteriorates.
But for now, I’m interested in looking at where the oil price might rebound. And for that, we need to turn to the charts.
Here’s where I’m looking to bet on an oil rally
One reasonable bet – based purely on previous price action – is that the answer lies somewhere in the $55 to $60 area.
Below is a monthly chart of WTIC since 2003. The $55-$60 level has a bit of a record as a support/resistance zone.
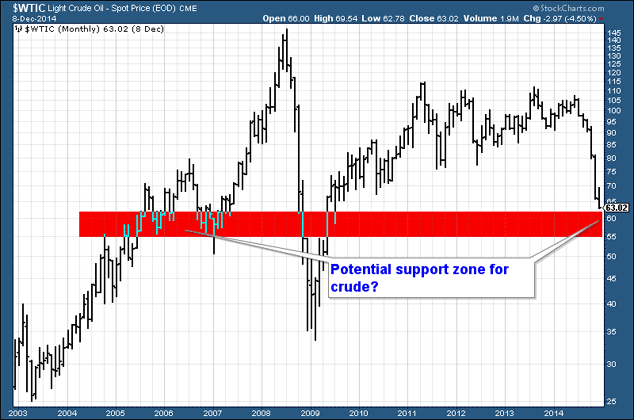
I know a lot of readers dislike my use of charts. But I like them. I don’t need to be clever. I don’t need to have encyclopedic knowledge of Opec’s output or Chinese consumption levels or whatever it is. I can just look at a chart and go: “I’ll try and buy oil below $60, and if it falls below $55, I’m wrong”.
I suspect oil’s is going to find some support in the red zone. But I recognise the risk in trying to catch a knife that’s falling with as much velocity as this, so I’ve got my exit marked in the event that I’m wrong.
And crucially, if I’m right, history suggests that getting it right on a rebound in the oil market could be very profitable indeed.
• Bitcoin: the Future of Money? by Dominic Frisby is available directly from the publishers Unbound, from Amazon.co.uk. The audiobook is available here.
Category: Market updates