Today we consider the outlook for crude oil.
Some say that oil’s running out. Until we can find better sources of energy, it’s inevitable that the price will rise.
Others say its recent falls are heralding a period of severe deflation – and that further falls must lie ahead.
They can’t both be right. So which is it?
Oil has been stuck in a very tight range
Oil has, broadly speaking, been stronger than other commodities, particularly the metals, but weaker than the stock market.
We’ll use West Texas intermediate crude (WTIC) as our benchmark.
Yesterday WTIC got hit hard, falling from almost $95 at one stage to close at $91.32.
The high for this year was $107 a barrel, back in June. The low was $90. We got that last week. So the range for the year has been $17.
Given crude’s notorious volatility, and the worsening geopolitical situations in various parts of the Middle East as well as Eastern Europe, $17 is actually pretty narrow. The range was $27 in 2012 and $33 in 2011.
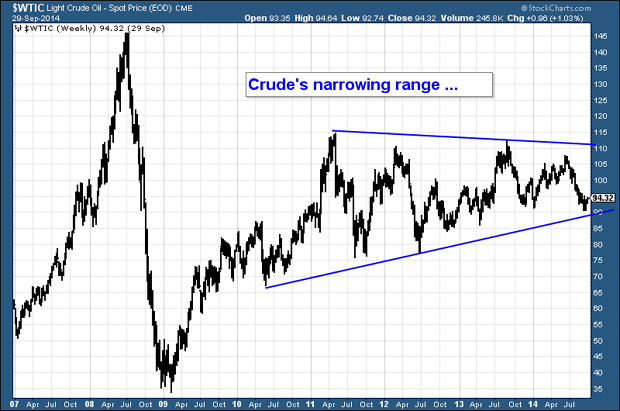
In the volatility of 2008 we saw a $112 (!) swing from the $147 high to the $35 low. But since then, oil’s story has been one of an ever-narrowing range and declining volatility.
On the chart below, which shows crude since 2006, I have drawn some blue lines off the highs and lows to illustrate this pattern.
“The bigger the base, the higher in space”, runs the saying. In other words, you often get large moves off periods of low volatility. I’m fairly sure we’re setting up for something. I’m not convinced we’re there yet, but it’s coming.
My instinct, whatever that’s worth, tells me that it will, eventually, be to the upside. For now the range prevails, and this will probably remain the case for another year or so.
From a short-term perspective, I would suggest the place to be here is long – as long as WTIC remains above that lower blue line, which is currently at about $91. $91 was support in late 2013, and it proved support last week.
If it does not hold, the range is broken and the bearish trade comes into play. $85 and then $77 would be the next lines of support. So that trend line is a useful point to mark risk, placing stops just below it.
But, like I say, I’m not expecting fireworks just yet – more a continuation of the range.
The cost of production is too high for oil to fall massively
Of course, oil could easily fall to $70 or so. But I don’t see how it can stay there for long, unless there are major financial problems somewhere, significant behavioural changes, or some fantastic new source of energy discovered and implemented.
Why? Because the cost of production is too high. One Wall Street research company, Sanford C Bernstein, estimates the average marginal cost of production to be $104.50 a barrel for non-Opec countries! And it is rising each year.
The table below, courtesy of Reuters, shows the marginal cost of production for various regions around the world.
Marginal cost of producing one new barrel of oil
| Regions | Dollars per barrel ($/bbl) |
|---|---|
| Arctic | 115-122 |
| Brazil Ethanol | 63-69 |
| Central and South America | 29-35 |
| Deepwater Offshore | 54-60 |
| EU Biodiesel | 106-113 |
| EU Ethanol | 98-105 |
| Middle East Onshore | 10-17 |
| North Sea | 46-53 |
| Oil Sands | 89-96 |
| Former Soviet Union Onshore | 18-25 |
| Russia Onshore | 15-21 |
| US Ethanol | 80-87 |
| US Shale Oil | 70-77 |
| WAF Offshore | 38-44 |
I was rather surprised to see marginal costs so low in some regions – the Middle East, Russia and the former Soviet Union. But the reality of real life, and taxes, as opposed to spreadsheetland, is often more expensive. Hence the old City maxim that a commodity should trade for twice its marginal cost of production.
If that maxim is right, then the current oil price is, all things considered, on the cheap side – even though it will be putting a lot of regions out of business.
It’s worth noting that oil-producing nations need a much higher oil price. Many oil-rich nations with large social spending and infrastructure plans are in deficit – they are not taking in enough revenue from their oil to meet their ambitions.
Today, eight of the 12 Opec nations need higher prices to cover their current expenditure. Below $90 and only Kuwait and Qatar can manage it.
Again, we thank Reuters for the following data:
Oil prices needed to meet expenditure ($/bbl)
| OPEC Country | 2012 | 2013 |
|---|---|---|
| Algeria | 121 | 119 |
| Angola | 81 | 94 |
| Ecuador | 112 | 122 |
| Iran | 123 | 136 |
| Iraq | 100 | 116 |
| Kuwait | 61 | 59 |
| Libya | 94 | 111 |
| Nigeria | 118 | 124 |
| Qatar | 59 | 58 |
| Saudi Arabia | 87 | 92 |
| UAE | 82 | 90 |
| Venezuela | 102 | 117 |
I’d say it was more likely that the oil price will be forced up than it is for certain governments to tighten their spending habits.
How to play the oil price
The easiest way to play the oil price is via a spread bet – but make sure you have a proper risk management system in place. Oil is very difficult to call and spreadbetting it without proper risk-management in place can be a widow-maker.
In general terms, I don’t like the oil exchange-traded funds (ETFs). My experience is that they bring you all the costs of futures (contango and backwardation) without the exposure to higher prices when they actually come.
The large oil companies – never sell Shell, and all that – also bring exposure, but, again, you often find the large caps are flat when the price is rising.
The best opportunities lie where there is the greatest risk – in the small caps that have the potential to grow. I’ll take a look at some of my favourites in a future Money Morning.
By the way, if you haven’t yet voted in the MoneyWeek reader awards, please do – it’s your chance to have your say on the best companies in the financial services sector.
Our recommended articles for today
A new way to invest in the pharmaceuticals sector
Huge pharmaceutical giants can end up with lots of drugs that are too small to make a difference to their business. That’s where this small-cap firm comes in, says David Thornton.
How to make Britain fall in love with fracking
If we want to get the public behind fracking, we’re going to have to do what they do in America, says Merryn Somerset Webb. We’re going to have to pay them.
On this day in history
1 October 1908: the first Model T Ford is built
On this day in October 1908, Henry Ford’s “car for the great multitude” – the Model T – was unveiled to the public. Over the next 19 years, 15 million would be built.
Category: Market updates