Have the last two years been nothing more than half-time in the great commodity supercycle? Or were they the beginning of the end?
Is the relentless bear market that has blighted mining over the last two years set to continue? Or are things levelling out before another run higher?
A chart that caught my eye last week might just give us some clues as to the answers…
BHP Billiton is key to the whole mining sector
First, let me give you some context.
BHP Billiton (LSE: BLT) is the world’s largest mining company. It has a market cap around £107bn. Its dividend yield is just over 4%. It produces just about every industrial commodity you can think of. Its biggest sources of revenue are aluminium, iron ore, coal, copper, uranium, oil, gas and potash. It also happens to be the world’s largest silver producer – but its silver is produced completely as a by-product.
Like just about every other miner, it has run into problems over the past 18 months. There has been an across-the-board failure by the large miners to recognise changing market conditions. Bloated with cash and perhaps a little dazzled by their own success, in 2011 they went on a costly acquisition spree – typical of market tops – that to led a spate of expensive write-downs.
The growth and expansion mentality was the wrong one. Instead (although it’s easily said after the event), costs should have been cut and margins protected. This is the course we are on now, though some argue this is a time to be buying assets cheaply.
BHP was by no means the worst offender in all this. In fact, chief executive Marius Klopper, who stood down this spring, will probably be remembered more for the acquisitions he failed to make than those that were successful.
There was the £97bn failed takeover of Rio Tinto in 2007-08. And a $37bn bid for Canadian Potash Corporation that had to be dropped. However, the failure of these acquisitions – particularly the latter – may prove to be blessings, with hindsight.
The acquisitions in which Kloppers succeeded – the purchase of shale producer Petrohawk Energy for $12.1bn, and the Fayetteville-based shale gas assets from Chesapeake Energy for $5bn, both in 2011 – went wrong. The price of gas fell. BHP had to announce a multi-billion write-down on the value of its US shale gas assets a year later. The poor chap even had to forego his bonus.
Shareholders will argue that these write-downs were all money that could have been paid out as dividends. But who gives a fig about the shareholders and dividends in this inflationary world of capital growth?
In any case, BHP would argue that its record on dividends is good. Its so-called ‘progressive dividend policy’ has seen its dividends grow for each of the last 13 years.
And with regard to its share price at least, BHP has outperformed its peers. Below, we see BHP since 1999. You can see the relentless rise through the early ’00s, then the collapse of 2008. There was a subsequent rebound to all-time highs – 2,600p – in late 2011, and then this period of consolidation we have seen since. We currently sit at 1,900p.
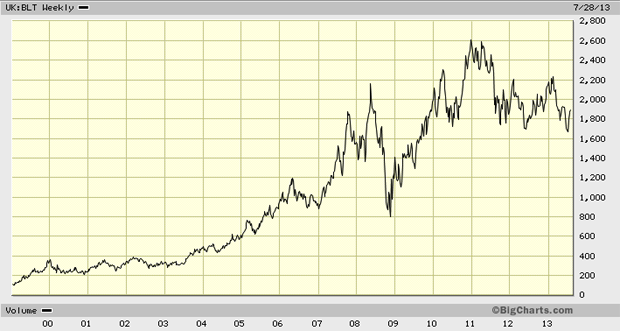
Source: BigCharts.com
It’s this period of consolidation I want to look at. Below, I’ve zoomed in on a chart of the last three years. I have identified the range in which BHP has traded since mid-2011 with the red bands.
The bottom of the range sits at 1,600p, the top just above 2,200p. In addition, a pronounced downtrend (outlined by the dotted blue lines) has been in place since March this year. We are now re-testing the top of the channel, circled in green.
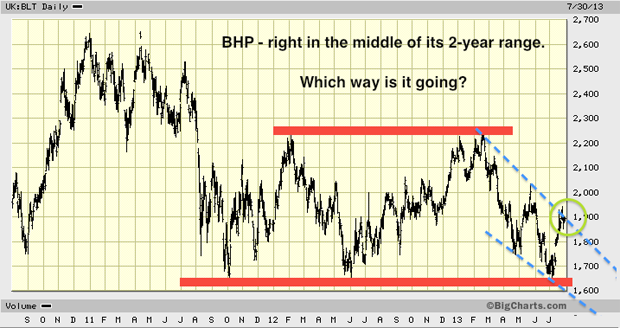
Source: BigCharts.com
Why this chart really matters
Why am I drawing your attention to this chart? Because this is a pattern we’ve seen a lot this year. We saw it in gold, for example, with $1,800 an ounce at the top of the range and $1,520 at the bottom. We also saw it in sterling between the $1.60s and $1.52.
The more a market re-tests a price, the less likely it is to hold. That’s because the more it hits that price, the smaller the pot of people prepared to buy or sell at that price becomes. Gold, for example, re-tested $1,520 seven times. Eventually it gave way ¬– we all know what happened next.
How many more tests of the highs or lows of this range will BHP take? That is the question. Eventually it will break out of this range. But which way?
This is a really important chart. BHP is the bellwether for industrial metals. Whither BHP, thither the entire complex. A number of people, including my colleague John Stepek, have noted of late that the miners are compellingly cheap.
And so little is now being spent on exploration, leading to fewer and fewer discoveries, that I am increasingly persuaded by the idea of a supply squeeze forcing base metals prices higher.
But that may still be some years away. And unlike many miners, BHP is still trading at more than double its 2008 crash lows and some eight times higher than its lows at the turn of the century. There is the potential to fall a long way!
A lot will depend on the way new boss Andrew McKenzie runs the company in this new era of mining austerity. But keep your eye on the price.
If that red band just above 1,600p is re-tested many more times, it won’t hold. And if it doesn’t hold, this idea that the last couple of years have merely been half-time in an ongoing bull market, will prove wrong. The grand commodity super-cycle really will be over. But if we break convincingly above 2,250p, that suggests we are facing yet another inflationary cycle.
I suspect that we’ll remain in the current range for a good few months, and I’ll be watching closely. But if you think that inflation is set to return, and you’re bullish on industrial commodities, then of all the mining giants, BHP is the one I would choose to own.
Category: Market updates