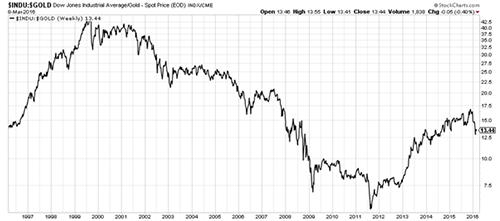
“The five year bear market for gold is over and we are at the beginning of a new bull market.” So says Pierre Lassonde, gold insider and CEO of Franco-Nevada. Speaking to BNN, Lassonde made the case for gold relative to stocks, as expressed by the gold/Dow Jones Industrials ratio.
I’ll get to the maths in a moment. But the idea itself of comparing the price of an ounce of gold to the nominal value of a stock index itself relates to Exter’s Pyramid. Where does money go when it’s on the move and the wolf is at the door?
The premise of the pyramid is that gold is the foundation of the world’s financial and credit systems. Stocks, corporate bonds and cash are not far behind. But in a deflationary crisis, or a liquidity crisis, capital flows “down” the pyramid to the base (gold). In liquidity there is relative safety.
That, I think, is one reason people look at the gold/Dow ratio as an indicator of the health of the financial economy. The lower the ratio, the higher the gold price and/or the lower the Dow. On the other hand, when the ratio goes up, stocks leave gold in the dust. Shares in productive enterprises that create shareholder value race far ahead of an asset that pays no yield and costs money to store. Have a look below at the ratio going back twenty years.
The top of the tech boom preceded the bottom of the gold bear market by about two years. That’s when the ratio peaked near 43. The Dow Jones Industrials were above 11,700 and the US dollar gold price was near $250/ounce.
Then crash, boom, bang!
Gold began a secular bull market and stocks entered the era of lower interest rates and, eventually, quantitative easing. When the gold price peaked above US$1,800 in August of 2011, the ratio was just under six. Gold then fell by around 41% until the (apparent) bottom in mid-December of last year.
Lassonde pointed out that the gold/Dow ratio was 1:1 in 1934 and again in 1980. During the height of the Great Depression, you could buy an ounce of gold at $36 and the Dow was at 37. In 1980 an ounce of gold cost you $800 and the Dow was 800. Today?
The Dow closed at 16,964 overnight and the gold price at $1,256. It doesn’t take you long to figure out that at a 1:1 ratio, the gold price would rise by 1,250% from here. And obviously, an ounce of gold would cost you roughly $17,000.
Lassonde didn’t say that would happen. But he did say that even at a 2:1 ratio, you’d have a gold price of $8,000/ounce. As I pointed out in the Facebook video update this morning (also available on YouTube now), these are the kind of forecasts it’s only safe to make when prices are moving in one direction. Analysts race each other to see who can make the most headline-grabbing forecast.
But think about it in terms of Exter’s Pyramid. In what scenario could gold go to $8,000? The past – though it’s no indicator of future results of course – shows that the gold/Dow ratio was 1:1 during a period of deflation (the Depression) and inflation (the 1970s). It’s happened in vastly different monetary environments.
Today, a sovereign debt depression could create the conditions where the ratio could approach 1:1. It would begin with a default in a peripheral or emerging market. But given how integrated and how much larger debt markets are these days, it would spread quickly. It’s a repeat of what happened on 2008, but on a bigger scale, and in the government bond market.
Governments that can print the currency in which they borrow can always pay off their debts by printing money. That’s not the issue. The issue is confidence. Given the state of the global economy (massive productive overcapacity), and demographic challenges in the West (and in China and Japan for that matter), what assets really are safe for the long run?
Category: Market updates


