There was an orphan question I asked you earlier this week. The country seems rich. But is it? Let’s get back to that today. And then let’s get to oil and China selling US Treasury bonds to defend the yuan against further big drops.
First off, it’s hard to tell how wealthy someone is by how they look. In fact, it’s foolish to try. A slob can be rich and a dandy can be broke. But, if you had magic glasses that allowed you see everyone’s net worth as you passed them by in the street, well, then you could know.
Short of stopping people to look in their wallet – which would probably constitute assault and/or robbery – the only way you can tell whether people are rich is to monitor what they do. Are they buying houses and new shoes? Or canned goods and torches?
Please note I said that you monitor what they do, not what they say. You can never really trust what people say, especially to a pollster. In public, people tend to tell you what they think you want to hear. Or, they give you an answer that makes them look good or shows them in a flattering light.
There’s nothing deceptive about it. It’s just human nature. We all like being liked. It’s in private, when the doors are closed and locked, that all the really intriguing human behaviour comes to light.
Whether they’re rich or not, the British people are happy and confident. At least they were in July. UK consumers reported the highest levels of confidence in 15 years in July, according to a new GK poll. Not since the heady days of January 2000 – two months before the peak of the dotcom bubble – have the British felt this good about the future.
The poll was taken before this week, when China crashed, markets buckled, and the whole thing nearly went cactus (to use an Aussie phrase). Do consumers and investors feel any different today than they did five days ago? Watch this space. In the meantime, check out the chart below.
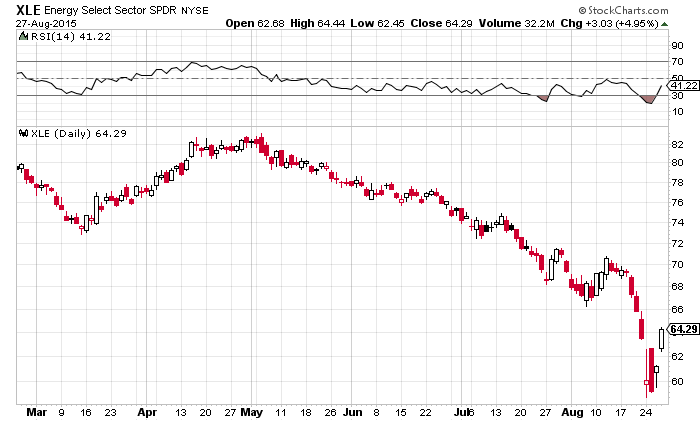
Energy stocks on the S&P 500 bounced hard and up. In fact, the October West Texas Intermediate crude oil contract jumped nearly $4 to $42.56. It was a 10.3% one-day move, the largest such move since March 2009. And you know what happened in March 2009.
That’s when everything began to melt-up, crude oil included. Back then, the catalyst behind the melt-up was fiscal policy, not monetary policy. For example, China’s stimulus package (which included reconstruction funds from the Sichuan earthquake) totalled four trillion RMB. You can see below that the size of that package, as a percentage of GDP, trailed only Saudi Arabia and Russia.
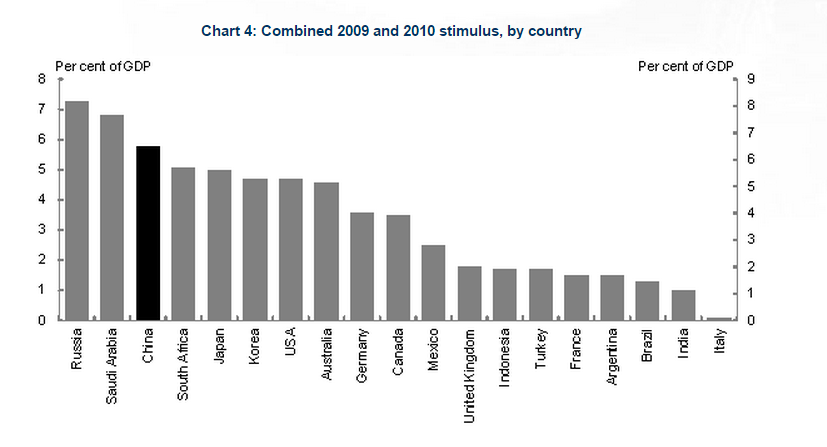
Source: Australian Department of the Treasury
Back then, there was also some ‘policy flexibility’ in terms of lowering official short-term interest rates. I’m going all wonky on you because I’d like to point out that today, there is a lot less ‘policy flexibility’ for both monetary policy (interest rates) and fiscal policy (stimulus/deficit spending). Where to from here?
According to the oil price, up! Which brings me to the question: is the oil price telling us that finally, at long last, markets are waking up to the inflationary implications of more quantitative easing (QE)? Or, is it just oil being oversold and markets saying that more QE is good for financial assets?
Not a lot has changed in relation to oil supply and demand. True, wire services report that Venezuela is angling for an emergency meeting of Opec to call for production cuts. Cuts would lower supply and increase the price. Venezuela – rapidly become a 21st century poster-child for the errors of socialism – needs more hard currency to pay for a dwindling supply of real goods in its economy.
At this point, I’d be inclined to tip my hat to Friederich Hayek and expound on what he called ‘the fatal conceit’, that central planners can ever know enough to set prices, production, and supply in a complex adaptive system (the economy). All of which is true. Hayek’s book is as relevant now as it was when it was first published in 1988 (not to be confused with The Road to Serfdom, published in 1944).
But it’s sunny out. And it’s Friday. And you probably don’t want to hear that.
Instead, I’ll simply point out that Opec is not going to cut production in order to keep Venezuela’s experiment in total wealth redistribution viable. The Gulf States have their own skins to save, and they’re busy trying to fight a US-fracking rebellion that’s challenged their status as the world’s most important exporters and swing producers of crude oil.
Also, it’s unlikely that the revised US GDP figures for the second quarter – revised up to an annualised pace of 3.7% – account for the rise in crude futures. Yes, faster US growth would probably lead to greater oil demand. But even if it’s relatively healthier than other economies, the US economy is not going to be the world’s engine of growth for 2016, at least not enough to spark a turnaround in crude oil prices.
What is it then? Crude being oversold? An inflationary melt-up in financial assets anticipating more QE? Or could it be worries about the US dollar?
After all, the crude oil is priced in dollars. The corollary to crude strength is dollar weakness. Granted, the dollar hasn’t looked weak lately. But what’s this business about China selling US Treasuries? What could the chart below possibly mean?
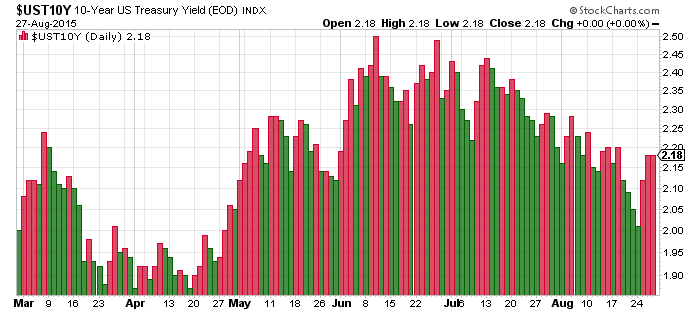
Source: www.stockcharts.com
The yield on the ten-year US Treasury Note is the most important price signal in the world. Many other borrowing costs are derived from whatever the interest rate on the ten-year note is. When it moves up, as with all bonds, prices go down. The chart shows up moves in US ten-year yield in red and down moves in green.
In price terms, the green moves show days when bond prices rose (bull!) and the red moves show days when bond prices fell (bubble!). Why would bond prices have fallen yesterday? Well, why does any price fall? Because there are more sellers than buyers.
What made yesterday interesting is that one of the reported sellers is China. That is, agents of the Chinese monetary authorities were reportedly busy in Europe selling pieces of their huge US bond war chest. But why? Are the Chinese bearish on the US dollar?
The simplest explanation is that China is raising cash to manage the decline in yuan. It doesn’t want its planned devaluation to turn into a crash. Between periodic declines, it may have to step into the markets to buy yuan and sell dollars.
When you sell something you increase the supply of it, theoretically pushing down the price (falling US bonds). When you buy something, you theoretically increase the demand for it and push up the price. That’s what China’s trying to do: sell US assets to raise cash, then sell dollars and buy yuan.
This currency wars stuff is reaching an interesting new phase. A dangerous new phase I should say.
Category: Market updates