When a commodity falls 64% in price, you’re bound to notice it. Lots of questions came in yesterday about oil, energy and the geopolitics of Opec. These are questions from Wednesday’s end-of-year investment summit being held here at Friars Bridge Court with Tim Price, Dominic Frisby, Charlie Morris and more.
The oil question – that’s the commodity that’s fallen so much since June of 2014 – is a doozy. Crude oil fell 5% in New York trading. The 13 members of the world’s largest oil producing cartel (Opec) could not agree on reducing production to support prices. It’s a spectacular price war.
Opec has a production quota of 30 million barrels per day – about one third of total global oil production. But it’s pumping out about 31 million barrels per day. There’s always an incentive to cheat on a quota when you’re a member of a cartel. If you can get away with it, you manage to sell more oil than you’re allowed without increasing supply so much that the price falls.
That’s not what’s going on now, though. It’s a contest for market share. The Saudis refuse to reduce production. They want to maintain their market share. They want to do so in the likelihood that Iran will increase its market share in 2016. Its nuclear deal with the West tucked in the back pocket, Iran would like to get back to producing around four million barrels per day.
You can’t ignore the geopolitics of the story either
In case you hadn’t noticed, Iran and Saudi Arabia are engaged in a series of proxy wars in the Middle East. They aren’t fighting each other directly. But in Yemen, Iraq, and Syria, the religious conflict between Sunni and Shia has state sponsorship on both sides. The Western media is generally too polite to report this.
We will probably not get too much into the geopolitics of the story on Wednesday. Why? There are too many unknown unknowns. We’ll stick to the price action.
Speaking of which, have a look at the chart below. It’s a 15-year weekly chart of the S&P energy sector with the relative strength index above. Study it closely.
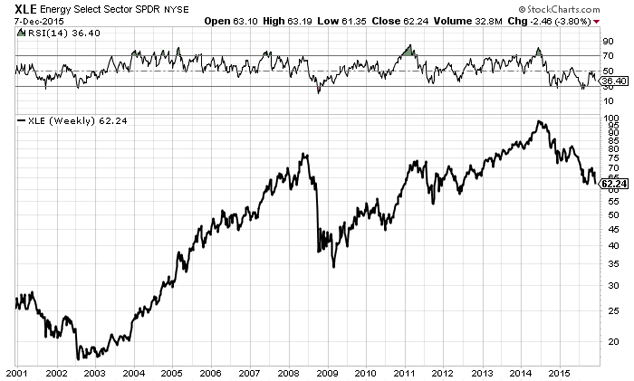
The XLE is composed 100% of US-listed energy stocks. The top ten holdings make up 63.41% of its holdings. If you were drawing a line between the 2003 low, the 2009 low and now, you might (just might) find a long-term line of support. Not that a line on a chart means anything.
But it’s a place to start the conversation on Wednesday. Is now the right time to buy some of the top energy producing stocks in the world? I’ll ask the panel on Wednesday. With the amount of experience in the room, you can be sure someone will have something useful to say about oil and energy stocks in 2016. In the meantime, comments and questions are welcome at dan@southbankreserach.com.

Category: Geopolitics