The acceleration produced by a force on a given mass is proportional to that force.
– Newton’s second law of motion
Today’s letter begins with a sense of anticipation and with Isaac Newton’s second general law of motion (see above). Disclaimer: price action in markets does not obey the laws of physics. Markets aren’t scientific or Newtonian. But what we’re looking for today is the inter-market relationship between the US dollar and the oil price.
First, the oil price. Half of the US shale oil producers could go bankrupt, according Fadel Gheit from Oppenheimer and Co. His interview with CNBC came on the same day that Morgan Stanley became the latest investment bank to lower its forecast for crude oil to $20 a barrel. The Morgan research note said a 5% gain in the US dollar could lead to a further 10%-25% fall in crude oil prices.
That fall in would send some shale-oil producers to the proverbial “wall” according to Gheit. High-cost producers need two things to make their business model competitive: a high oil price and cheap debt. Without both, it’s curtains. Here they come.
It’s not only the marginal producers in trouble, though. The longer prices stay low, the more likely it is that the majors – ExxonMobil, Royal Dutch Shell, and Chevron – could be forced to cut their dividend. Income hunters beware! US crude oil prices closed at 12-year low of $31 per barrel. Which brings me to the charts below.
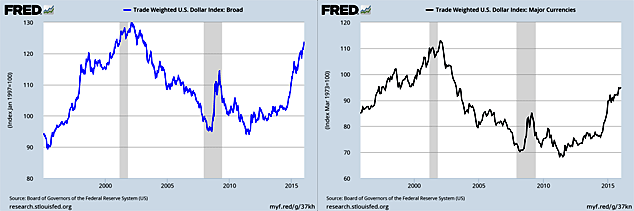
Source: www.research.stlouisfed.org
How much of the oil story is oil and how much is the US dollar? You can’t separate the two, since oil is priced in US dollars. But you can’t answer the question without looking at the trade-weighted US dollar index. There are two of them; one against a broad basket of currencies (that includes emerging-market currencies) and one against major currencies such as the euro, yen, and pound. Have a look at both above. What do you see?
The broad index which includes emerging-market currencies (on the left) shows the dollar index approaching a new 20-year high. The last high was in the early years of the dotcom crash. Global capital fled “risky” assets and went into the dollar. But in the post 9/11 era of high US fiscal deficits and double-digit, commodity-intensive growth in China (along with the reduction in US interest rates), the dollar got weaker. Commodities soared.
You even had people claiming that a currency like the Australian dollar – highly correlated to Chinese growth and commodity prices – was a new global reserve currency. Norway’s currency boomed. So did the Canadian dollar and the New Zealand dollar. So what?
The move in the broad trade-weighted dollar index shows that emerging-market currencies are usually “worthless”, in the words of Charlie Morris. We spent some quality time at the Bloomberg terminal this morning looking at Brazil, Japan, and Russia.
Those are stories for another day. For today, Charlie said the broad index confirms that “emerging markets aren’t just a knife. They’re a hot knife falling at an accelerating rate”.
Keen-eyed and mild-mannered John Stepek entered the fray at this point. He said a more accurate measure of how much longer the US dollar bull market can go on would be to look at the dollar index against other major currencies. That’s the chart on the right with the black line. And John was right.
This: a move higher in both dollar indices could coincide with a crash in the oil price to $20. That could also come in the context of another 10%-15% “managed devaluation” in the Chinese yuan. All three of these are tradable events if you’re a speculator. But all give you some indication of how much worse things could get for oil and how much better things could get for the dollar (or worse for Chinese stocks).
In Charlie’s terms, these are two sides of the same coin. The “momentum crash” is when something that’s already beaten down can fall another 80%. It’s usually followed by a momentum “melt up”. In business terms, the liquidation of the marginal producers results in a new equilibrium price. It’s happening in oil. But not just yet.
And for the dollar? Well, you can never know what’s going to happen in the world that corresponds to a high or low in an asset class. The chart doesn’t “cause” the move. But it does explain it, and, inasmuch as these things are possible (which admittedly, is not very much), it foretells it. Why?
Charts are a visual representation of what everyone in the market thinks they know and what they value. Assuming the chart isn’t meddled with (distorted price signals) it tells a story. Different people can look at it and see different stories.
In the case of the peaking dollar index, it tells you the “narrative” in markets of a stronger dollar, higher US interest rates, and crashing commodities and emerging markets is reaching an apex. Maybe not this week or this month, or even this quarter. But it’s coming.
What will actually “cause” the peak? Well, you can never know that. But you can surmise that something in the world is likely to happen which will cause investors to sell dollars and buy oil again. But probably not until after the “momentum crash” in oil. Charlie’s been working on these ideas in his new project. You’ll hear more about that shortly.
Category: Economics