Two stockmarket crashes in ten years utterly crushed the hopes of British investors.
It’s taken the FTSE 100 17 years to reach new highs since the tech wreck of 2000.
Not since the Great Depression has the power of crashes been demonstrated so completely.
They can set you back decades on your path to building a nest egg for retirement.
If you ever manage to recover.
What to do in the coming bear market
Unfortunately, the indicators that investors need to watch to anticipate a crash are flashing red once more.
Just as they did in 2000 and 2007. Alone, any one of these indicators might be ignorable. But together, they suggest we’re in for another crash in 2018.
The good news is, you can protect yourself. And there are some investments which might escape the coming carnage and even deliver a good return.
The bad news is that another stockmarket crash could destroy our financial institutions like pension funds and banks. More on that below.
First, let’s look at why I’m so worried about a crash in 2018.
There are three types of stockmarket indicators. There’s valuations, which tell you whether stocks are cheap or expensive.
There are sentiment indicators, like margin debt and options pricing, which tell you what investors are expecting to happen and how sure they are. And there are indicators from outside the stockmarket, which have a big effect on stocks.
Right now, all three are flashing red.
Stockmarkets have a value, and a price
Let’s take valuations first.
The idea that stocks are expensive or cheap can be confusing. So let’s look at a different asset first to illustrate the point.
Imagine you buy a new car at a 10% discount and try to sell it a year later because your publisher wants you to move to London from Australia. You know the usual 19% drop in the value of a new car becomes far less of a tumble thanks to the good deal you got initially. You can expect about 9% losses instead of 19%.
In much the same way, buying stocks cheaply improves your return.
If you buy stocks when they’re overvalued, you’re expecting smaller gains, or even a loss.
It doesn’t just come down to price. You can’t judge a car only by its price.
You have to adjust for its characteristics to determine its value. A £50,000 Renault is expensive while a Porsche would be very cheap. Depending on what you find under the hood, that is.
The same sort of thinking applies to stocks. You have to think in relative terms. There are plenty of considerations. But the most important is earnings.
The amount of profit a company makes is what investors are most interested in. Buying a share in a company buys you a share of the claim on the company’s profits, after all.
Valuations like the price/earnings ratio (P/E) tell you whether a stock is cheap or expensive given its earnings. It tells you how much you’re paying for the company’s profits. A P/E of 1 tells you you’re paying a pound for every pound of profits the company is making if you buy the shares.
Put differently, if the company paid out every pound of profit in dividends, you’d get 100% returns each year.
A P/E of 1 is very cheap – almost impossible to find. Normally stocks sell for around 17 times earnings, a P/E of 17. You’d have to wait 17 years to get your initial investment back in dividends if all profits were paid out each year. Not that companies do this, by the way. They reinvest their profits to grow the company. And hopefully that grows profits.
What about right now?
Are stocks cheap or expensive?
Should you buy or sell?
The chart below shows a version of the P/E ratio which values the stockmarket as a whole. It tells you how much investors are willing to pay for company profits. When the cyclically adjusted price-to-earnings (CAPE) ratio is high, investors are paying a lot of money for stocks – they’re expensive.
As the CAPE ratio’s creator explained on CNBC, stocks have only been more expensive during the tech bubble and just before the Great Depression. That’s a phrase you’ll hear a lot when people talk about the stockmarket at the moment.
While that sounds ominous, take a look at how much more overvalued stocks can become. And that’s in a world without tsunamis of quantitative easing (QE) to push up stocks.
My favourite expert when it comes to valuation of the stockmarket is John Hussman. He followed valuation metrics carefully to predict the 2000 crash. Last year he declared this “the most broadly overvalued moment in market history” based on an adjusted version of the P/E ratio.
Hussman argues that a balanced view of the various ways you can value stockmarkets implies they will perform poorly over the next ten years. And that implies a crash.
But does this sort of thinking really work? Here’s a quote from Hussman in March of 2000: “Over time, price/revenue ratios come back in line. Currently, that would require an 83% plunge in tech stocks.”
The 83% plunge in tech stocks predicted based on valuation metrics proved rather accurate:
Recall that following that peak, the S&P 500 did indeed lose half of its value, the Nasdaq Composite lost 80% of its value, and the tech-heavy Nasdaq 100 Index lost an oddly precise 83% of its value.
Oddly precise is good enough for me.
We’re in frighteningly similar circumstances today. Focusing on the
valuation measures that proved valuable in the past, you get much the same conclusion today as in 2000:
… the consensus of the most reliable equity market valuation measures we identify (those most tightly correlated with actual subsequent S&P 500 total returns in market cycles across history) advanced within 5% of the extreme registered in March 2000.
Not much more and we’re in uncharted territory for how expensive stocks can become.
Using similar analysis, portfolio manager Dylan Grice explained his forecast for stocks at a recent Societe Generale conference. He said the Shiller CAPE valuation model, from the chart above, implies a 2% loss in US stocks over the next decade, after inflation.
It’s not as bad as buying a new car, but 2% losses over ten years doesn’t paint a pretty picture for the stockmarket.
But ten years is a long time. And 2% is just the expected outcome. Historically, the same sort of forecast delivered up to 8% gains instead. A 2% loss is just the implied return you’re accepting by buying now. It doesn’t tell you whether or how many crashes there might be in the meantime.
Whether it’s a crash or just a slump in returns, valuations are clear: stocks are expensive. But that’s just one measure that matters.
Investors are irrationally exuberant
There are many ways to measure investor confidence. Pay attention to a few of these and you can tell whether they’re overconfident.
Perhaps the most famous indicator of sentiment is margin lending. This is when investors borrow to invest in stocks. It increases their risks and returns enormously. So investors only use it when they’re confident. But thanks to the way margin lending works, margin lending can trigger a crash.
Investors must keep something of value with their lender when they borrow to play the stockmarket. It’s like the mortgage your bank has over your home. But there’s one big difference. If the value of stocks fall, the lender can demand the borrower adds to their reserves kept with the lender. This is the dreaded margin call – also the name of one of the famous films about the financial crisis.
Because investors struggle to meet margin calls during crashes, they just sell out of their position. And that exacerbates the crash. In other words, not only does the level of debt tell you how confident or overconfident investors are, it also tells you how likely the market is to crash. The combination is what makes margin debt so popular as an indicator.
This crowded chart shows you how the amount of lending to invest in stocks is hitting record highs. It did the same just before 2000 and 2007. But back then, the levels were still small compared to today.
But such borrowing isn’t the only way to measure sentiment.
Options are a type of bet on financial markets. They can be used to insure against a stockmarket crash, or to bet on a surge in stocks. They factor in volatility and the probability of various outcomes. That makes them useful as indicators of the future as well as investment tools.
Just as flood insurance is most expensive in places at risk of flooding, stockmarket options are expensive depending on what people expect to happen. The indicator flashing red in options markets is the price of options betting on a fall in the market (put options) relative to options betting on a rise (call options). American put options are extraordinarily cheap relative to call options. Cheaper than they were in 2007.
This means punting on stocks going up has never been more popular relative to insuring against a crash. Put differently, people don’t expect a fall in stocks. They expect them to rise. And they’re most confident since 2007.
By fiddling with the options pricing formula, you can calculate the implied probability of a stockmarket drop. That sounds odd, so let me rephrase. Given the price of options, the probability of a 2% drop in the stockmarket in the next month is below 10%. The previous lows were about 15%.
If you’re confused, just think about options as insurance. It’s cheap to buy insurance against theft in Japan. Because the crime rate is low. In the same way, if it’s cheap to buy theft insurance at your home, you can thereby deduce the crime rate is low in your area.
Options are similar to insurance. People buy them to protect from a crash, or to profit from a rise. Options pricing is telling you the level of optimism and the lack of fear are at alarming levels. Levels they tend to be at before a crash. The Japanese are about to get robbed.
Crash indicators outside the stockmarket
Citigroup’s chief economist Willem Buiter provides the executive summary:
“There are clearly signs of late-cycle froth in financial markets, in everything from equities, to corporate credit, and real estate, especially in the US. There is the risk of an overdue correction.
“We are reluctant to call an end to the bull-market in risk assets just yet but a considerable degree of caution is now warranted. Downside risks are rising as the business cycle matures.
So the global economy is due for a recession given they happen every seven or so years. The run up in bonds and real estate is looking stretched. The S&P 500 is approaching the record amount of days without a 5% correction. Interest rates are at all-time lows, which should mean they’ll rise. If they rise too fast, stocks could take a hit as debt becomes expensive.
Despite all this, the volatility of financial markets is at extraordinary lows. The most famous indicator of volatility is the VIX. This chart goes back to September of 2015. It shows how the volatility of markets in the US and EU has been on a steady downtrend for years now.
At some point, that’ll snap. And when it does, the crash in prices will be faster than anything investors can imagine.
These may seem like arbitrary and indirect indicators. But the point is that they’re all suggesting trouble in the stockmarket. And yet, expecting a crash may not be the best thing to do.
If a crash can come anytime, you can’t just wait
Jeremy Grantham is one of the most experienced and wise investors out there. He’s probably been burned by mistakenly predicting a bear market one too many times. So, recently, he made a point you need to keep in mind.
If we can agree that stocks are overvalued and in a bubble, then clearly valuations and prices aren’t the key driver at this point. If overvaluation was enough to tip stocks over the edge, then overvaluation wouldn’t really have happened to begin with.
Here’s how Grantham explains it:
Extreme overvaluation plays a huge role in bubbles breaking: It is a necessary precondition. The more overvalued, the merrier. But, for judging the extent that bubbles will overrun fair value and for timing the break, value, sadly, is largely irrelevant. Thus, it is a necessary but absolutely not sufficient condition.
Instead of watching valuations to predict a crash, Grantham considers them a binary variable. If stocks are very overvalued, it’s a bubble. But how overvalued they might continue to get is unclear, so this doesn’t help you.
Instead, Grantham argues, look for other signs. Such as the sentiment indicators I outlined above. When they get absurdly overconfident, the rally is weak.
One reliable indicator is something called a melt-up or blow-off rally. When prices go bananas. They almost always do at the end of a bubble, just before it pops. And we haven’t really had such a rally or melt-up yet.
That’s why Grantham finds himself torn between the valuations he believes rule the market and the missing blow-off rally. In his note to clients, he’s made the call. There will be a melt-up before there’s a meltdown. A 50% rally in the US stockmarket is in the cards. Before an impressive bloodbath.
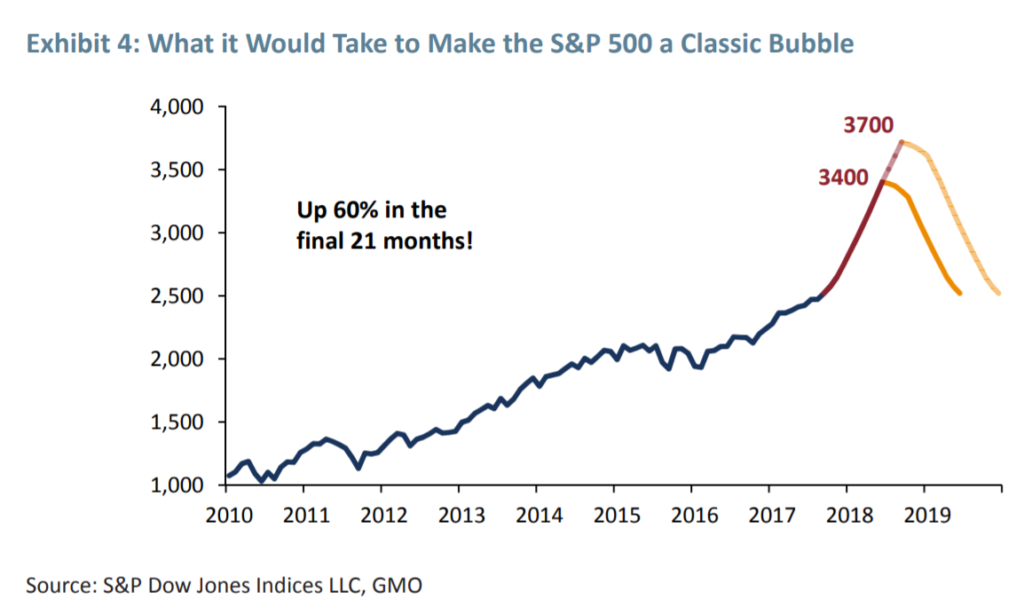
Recent academic research into bubbles suggests the common denominator for bubbles is acceleration in the price growth. That parabolic shape you see in price charts which features before a crash. Which we haven’t seen in the stockmarket. Yet.
So where are we now? Grantham calls it Base Camp. It’s the point from which the melt-up or blow-off rally begins.
If you apply the above bubble features to the S&P 500, then we’d need a 50% rally before you need to be scared.
And yes, that sounds absurd at already stretched valuations. But investors will be thinking “who cares when 50% gains are on offer?”
What to do in a bear market
The real problem with all crisis indicators is that they tell you little about what could happen in the short term. We could see stocks surge for five more years before they crash. By the time it happens, you’ll be sick of the warnings and go all in on the stockmarket.
That’s why investment professionals don’t often watch for crashes. They look for bear markets. These are periods of time, usually 1-3 years, when stocks are going to go down or sideways. Usually they involve a few crashes. But why bother owning stocks when they’re in a bear market in the first place?
Instead of avoiding overvalued asset classes, reverse your thinking. Invest in the best possible investment at any given time. The one with the cheapest valuations.
Right now, that’s commodities.
Where to invest in the coming bear market
Just because stocks are expensive and investors are overconfident they’ll keep going up, doesn’t mean you can just ignore investing. There are many other asset classes. Some of them are good crisis hedges. Others are cheap according to the same or similar valuations methods we just discussed.
I’d like to introduce you to my favourite crisis hedge. And point out one sector of the financial market which is undervalued – cheap.
Investing in gold is by far the best way to protect yourself from a financial crisis. The price tends to rise during a stockmarket crash. And if you own your gold outside the financial system, you are protected from its failures.
Right now, the gold price is set for a bull market. It’s reacting positively to the Federal Reserve’s interest rate increases in the US.
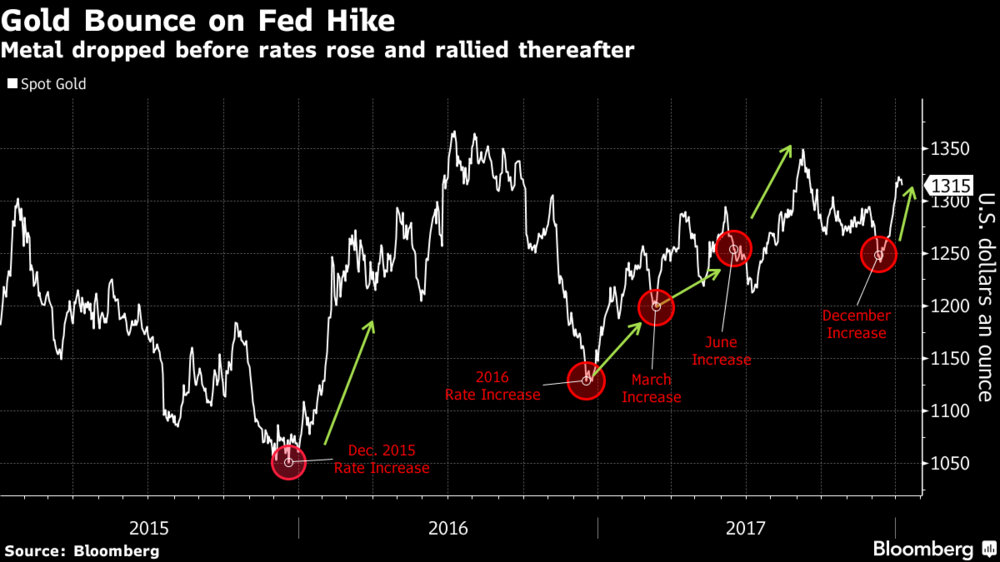
This is unusual because people expect gold to do well during inflationary environments. The rate hikes are supposed to slow inflation.
But consider the last time gold behaved this way. It was just before the impressive bull market last decade. You can find out more about that and gold here.
Now is the time to invest in commodities
Do you remember how stocks are expensive relative to their earnings above? Well, commodities are incredibly cheap relative to stocks right now.
The chart shows the value of a commodity index divided by the broader market. Specifically, the Goldman Sachs Commodity Index (GSCI) divided by the S&P 500. When it’s high, commodities are expensive compared to the stockmarket. When it’s low, commodities are cheap.
As you can see, it’s at the bottom of the range. A surge in commodity prices is a good bet based on mean reversion – a return to historical average.
The last time we were here, the ratio turned upwards on a long bull market. The GSCI quintupled. In 1971 it did the same.
When commodities move like that, it creates an extraordinary stockmarket boom too – in commodity shares anyway. During the boom that began in the late 1990s, BHP’s London share price went up tenfold. Rio Tinto’s quintupled alongside the commodity index. Randgold Resources went up tenfold. And these are the major producers. Their share prices are supposed to move slowly!
If you want to bet on a commodity boom, there are a selection of ways to do it. You might invest in the physical commodity by buying the actual stuff, or exchange-traded funds (ETFs) that hold resources via your brokerage account. Or perhaps a basket of the world’s leading commodity companies on the stock exchange.
You could pick the individual companies you like most and buy their shares. Some offer fascinating opportunities that can withstand even a widespread bear market.
When stocks crash, look out for even worse consequences
The stockmarket is one thing. What about the rest of your financial life?
Can your retirement afford another stockmarket crash? Do you think the government and private pension funds will stay afloat? What about our banks and other institutions? Without those lending freely, other companies will go bust too.
My point is that a crash in the stockmarket is more serious today than ever before. More people rely on the price of financial assets to pay their bills than ever before. More businesses rely on functioning financial markets to keep their doors open. And more governments are at risk of a fiscal crisis.
If there’s another crash, I think governments will be forced to take more drastic countermeasures than you ever thought possible. And their plans include something very dangerous for people like you. Because protecting yourself from a financial crisis will make you a target.
The War on Cash
I’m anticipating that governments will seize the opportunity in the next stockmarket crash to fight a decisive battle in the War on Cash.
Governments want to know everything you do. It allows them to discover what people are up to, find criminals, and provide the proof they need of wrongdoing. If they can force all transactions into the digital world, that creates a record they can access for all three.
The problem here is that the definition of a crime can change very quickly. What was once your right could become wrongdoing tomorrow. By winning the War on Cash, government’s ability to enforce its stupid laws will be absolute. You won’t be able to hide.
But there may be a way out…
What about cryptocurrencies?
Will cryptocurrencies survive a crash? Will they surge as the government cracks down on your financial freedoms in order to save the system?
To be honest, I’m simply not sure. I change my mind about this question all the time. And the evidence proves it could go either way too.
In countries like Venezuela and China, cryptocurrencies are extraordinarily popular because of their ability to evade the financial system and thereby the government. So it would seem the same could happen here. The War on Cash will simply drive people into cryptocurrencies.
The question is whether this happens in a meaningful way for you. Especially during a crash in the financial system. For example, it currently remains inconvenient and expensive to transact in cryptocurrencies. Especially with regulated business. And you can’t sell your cryptocurrencies easily in a world where the financial system is being clamped down on.
People in Venezuela rely on functioning financial systems in the US to order basic supplies using bitcoin, for example. Without such access, bitcoin wouldn’t be of much use for them.
In a crisis like the one I’m expecting, the useability of cryptocurrencies becomes the key issue. Their price is less important when you can’t sell out.
If innovations make it easy to use cryptocurrencies, then they may well become your last escape in the War on Cash. And that potential would see them soar in price just when your stocks fall.
Why not own a small stake in an asset with such extraordinary potential?
The Fail Safe Portfolio
Of course you can’t pile all of your wealth into cryptocurrencies and gold. Although they should form an increased part of your portfolio, that portfolio must remain diversified.
Tim Price of London Investment Alert has designed a portfolio that takes the conclusions of this report into account. He even wrote a book about the War on Cash.
If you agree with the threats and opportunities in this report, I urge you to take a look at Tim’s research. Especially the Fail Safe Portfolio.
Nick Hubble
Capital & Conflict
|
READ: Fund manager’s urgent letter to UK investors A critical stock market indicator has just reached a point that’s only been seen twice before in history. The first time was the Wall Street Crash of 1929… The second was the dotcom bubble in 2000. Both times saw British stocks halve in value. Tim Price explains what you need to do with your money. Capital at risk. A regulated product issued by Southbank Investment Research Ltd. |
Related Articles:
- Beginners’ Guide to Investing in Crypto
- Guide to Understanding the Price of Gold
- Investing in Precious and Industrial Metals
Category: Economics