Predicting the Japanese bond market will crash is known as the Widowmaker trade.
If you take a look at the fundamentals, the conclusion is obvious. A bond market crash in Japan has to happen. But it should’ve happened a very long time ago. But it hasn’t happened. So what’s going on?
The fact that it never seems to happen is what makes this trade the Widowmaker. People who take a punt on the inevitable discover it is illusive.
The famous hedge fund manager Kyle Bass is one of the Widowmaker trade’s victims. Here’s his rather simple analysis for why the Japanese bond market is in trouble:
[Bernie] Madoff’s [ponzi] scheme collapsed for one primary reason – he had more investors exiting his scheme than entering. As soon as this happened it was over. According to this most recent census, the Japanese population peaked within the last few years at 127.9 million and has since lost 3 million.
This trend is set to continue as the Japanese population shrinks, fast.
The basic idea is that retirees sell bonds to fund their retirement while middle-age workers buy them for their prospective retirement. If you have a lot of people retiring and not many working, the proportion of buyers to sellers begins to fall. This is known as the M/O ratio – the ratio of middle-age to old-age people.
If you chart the M/O ratio of a country over time, it tells you the number of investment buyers per seller based on their age group. Academic research has shown this predicts price/earnings (P/E) ratios in the stockmarket. That’s a complicated way of saying it predicts stockmarket performance, adjusted for how much companies earn in profits.
Here’s a chart of several countries’ M/O ratios from the Federal Reserve Bank of San Francisco’s Economic Research Department:
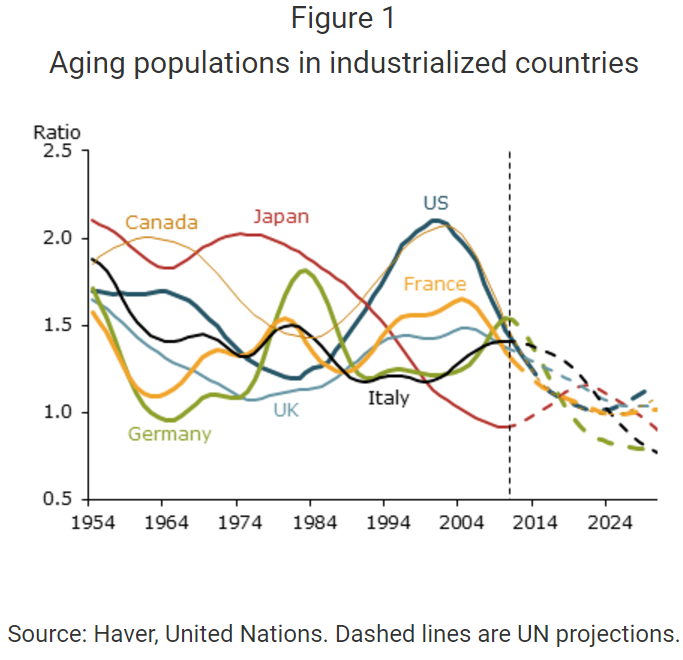
As you can see, Japan’s demographic decline really accelerated in the late 1980s. The ratio of middle-aged buyers fell from 2 to 1. The stockmarket followed suit and crashed before going sideways.
As the projected M/O ratio shows, there’s an upturn in 2012, followed by another downturn in 2020. Again, the stockmarket is following suit with a recent rally.
The M/O ratio was clearly an accurate predictor of Japan’s stockmarket. A wave of retired people sold out and there weren’t enough young buyers to take their place. The brief reversal in the trend shows up nicely in the stockmarket too.
But why didn’t the bond market face the same fate? Japanese investors love Japanese government bonds (JGBs). More on that in a second.
What else does the M/O chart show you? The US M/O ratio hit its peak in 2000, at the height of the tech bubble. That’s not a bad call either for stockmarket investors. Italy peaked in 2012, when the European sovereign debt crisis was at its height.
The UK’s ratio is more stable. But everyone is on the way down long term. That means there are less and less people of investment-buying age per person of selling age. More sellers and less buyers.
You can guess what that means for stockmarket prices.
But not so fast.
I think stockmarkets clearly show the influence of the M/O ratio and the theory behind it. But there are two key questions to ask if you’re still with me:
Why didn’t Japanese bonds crash?
Why has the US stockmarket recovered so strongly while its M/O ratio hasn’t?
The new Widowmaker
The answer to those questions is the same as ever – central banks. The Bank of Japan (BoJ) only intervened in the bond market until 2010. That’s why stocks crashed and bonds didn’t. Bonds had a buyer with an infinite budget, stocks didn’t.
These days the BoJ buys exchange-traded funds (ETFs) full of stocks, and the Japanese Nikkei index has surged.
Meanwhile, in the US the story is similar. For now the Federal Reserve isn’t buying stocks. But the Swiss central bank owns more than $60 billion in US stocks alone, for example. And the Fed has intervened by lending to banks which do buy stocks and by buying other assets like mad.
Here’s a survey of what central bankers expected to buy at the beginning of this year compared to last year, from The Wall Street Journal:
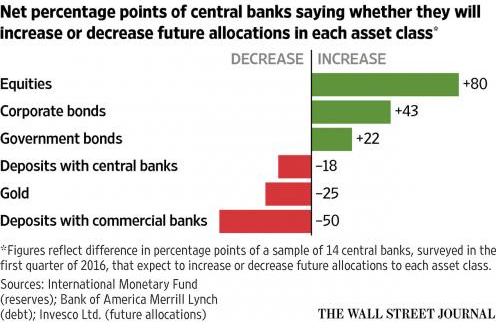
This is brand new funny money flowing into stocks and bonds from central banks. It also explains the languishing price of gold.
In other words, central bankers dominate the markets everywhere. You probably already knew that if you’ve read any Capital & Conflict in the last few months.
In 2012, Kyle Bass predicted that Europe’s sovereign debt crisis would trigger Japan’s. But it didn’t. So what set apart Portugal, Ireland, Italy, Greece and Spain from Japan? Indeed, Japan’s sovereign debt position is far worse than any of the PIIGS.
Hint – it’s all to do with central banks once more.
The BoJ serves Japan. Who does the European Central Bank (ECB) serve? The eurozone, not its individual member governments or their peripheral stockmarkets.
Compare the ECB’s efforts as part of the austerity-imposing Troika to the BoJ’s enthusiastic quantitative easing efforts and you can see how important central banks politics is.
Gideon Gono’s revenge
Japan probably isn’t very interesting to you. It wasn’t to me until recently.
The reason I highlight Japan to you is simple. We’re turning Japanese. Demographics in Western countries closely resemble the way Japan turned in 1990. But that means we can see our own fate many years in advance.
It’s been many years since Bass took his position on a Japanese bond crash. The quote above is from 2012, long into his bet. And many punters came before him.
Perhaps the lesson you can draw from Japan is that central bankers and governments can kick the can down the road incredibly long. If you give them the power to do the kicking in the stockmarket, they will. Especially now that the markets expect them to. That explains the revival in the US and Japan.
Japan’s central bankers were slow to catch up. They didn’t realise they could get away with the likes of the policies they pursue today until other central banks tried it.
Who would’ve thought central banks could buy stocks each month? Not even the Oxford educated Gideon Gono, Zimbabwe’s former central banker. And he presided over one of the most successful stockmarkets in history. If you ignore inflation.
In this environment, you might be able to see an inevitable crash around every corner. But it might just be a new Widowmaker.
Until next time,
Nick Hubble
Capital & Conflict
Category: Central Banks