If you want to know where the global economy is heading next, it’s a good idea to keep an eye on the price of ‘hard’ commodities.
Before factories can produce any goods, they need extra supplies of raw materials. So rising commodity prices are a solid indicator that global demand for goods is rising. One raw material in particular – copper – is seen as a good indicator of future economic growth.
But here’s the really interesting bit: we can also use copper to forecast the stock market. For this, we need to look at how its price performs compared with another key commodity – oil.
The smartest metal in the world
In some circles, copper is known as ‘Dr Copper’: the metal with a PhD in economics. Copper earned this nickname because it’s one of the most important and widely used base metals around. So demand for it rises and falls along with the wider economy.
Copper conducts electricity better than any metal except silver. Around two-thirds of all the copper produced is used in electrical applications. These include power generation and transmission, and also circuitry, wiring and contacts for PCs, TVs and mobile phones.
Another quarter of the copper produced is used by the construction industry for plumbing, roofing and cladding. Throw in transport and medical applications – the metal’s antibacterial qualities help to reduce the spread of disease – and you’re getting the picture.
Compared with copper, oil is a little less volatile. Sure, it has a wide range of industrial uses. And demand for ‘black gold’ also rises and falls along with the strength of the global economy.
But there isn’t such a massive swing factor at work as with copper. Oil demand tends to be pretty solid, even during severe recessions. And supply tends to be tighter too.
As my colleague Merryn Somerset Webb pointed out a month ago, “In 2001, global oil use was 77 million barrels per day (mbpd). In 2011, it was 89.6 mbpd – a rise of 16% in ten years. Even in 2009, a particularly nasty year for the global economy, global oil use fell by only 2%. But by 2015, the International Energy Agency expects it to be 99.1 mbpd – a rise of another 11% just in four years”.
So if the price of copper is rising faster than the price of crude, then that’s one of the best signs around that the global economy IS improving. That’s because this suggests that it’s growing demand driving rising prices, rather than tight supply (as can be the case with oil).
And it’s also good news for stocks. “When copper is accelerating faster than oil, stocks tend to do particularly well”, says Gina Martin Adams at Wells Fargo. That’s because an outperforming copper price will translate into higher profits for industrial companies around the word. In turn, that drives up global equity markets.
A warning from Dr Copper
So far in 2012, copper has risen around 11%, while oil is up 7%. At first glance, that might look like a ringing endorsement of this year’s strong stock market rally.
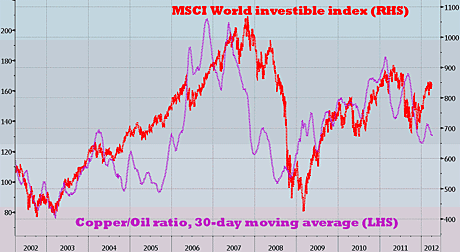
But look at the ten-year chart below.

Source: Bloomberg
The purple line is the copper/oil ratio, ie the copper price divided by the oil price. When the purple line is rising, copper is doing better than oil. (I’ve plotted the 30-day moving average to strip out daily volatility).
The red line is the MSCI World investible index, a widely watched global stock market gauge that’s climbed strongly this year.
Here’s the key point: over the last ten years the copper/oil ratio has either moved closely in line with world stocks, or has anticipated their next major directional move.
For example, it called both the 2007 market top and the 2009 low several months before they happened. Further, it peaked nicely ahead of the 2011 market high point.
And now, our copper/oil indicator is sending out a warning signal that world equity indices could soon be heading down. Although the ratio is slightly up for 2012 so far, of late the moving average has been dropping again.
This chimes precisely with what John Stepek said yesterday about China.
“China’s huge investments in infrastructure and property are almost certain to slow down”, he says. “China has been the commodity consumer of last resort for years now. If that changes, then it’s hard to see how it can be anything but bad news for industrial metals and the like. There isn’t another country with the appetite to pick up the slack – even if the US economy recovers”.
Take steps to protect yourself
Now you could look at that chart and say: “Hey, there’s nothing to worry about at the moment. We’re talking long time lags. World stock prices could still be fine for several months”.
You could be right. But the chart is still sending out a very clear message: the future for stock markets is set to be much choppier than the recent past. While things are still quite calm, this is a good time to take steps to protect your portfolio against a possible nasty sell-off.
Meanwhile, Phil Oakley has done a wide-ranging review of whether pensions or Isas are the best way to save for your future. It’s well worth a read.
Category: Investing in Technology

