On 12 November last year, the International Energy Agency (IEA) declared that, thanks to ‘fracking’ – blasting dense underground rocks apart to release fossil fuels within – the US would overtake Saudi Arabia to become the world’s biggest oil producer by 2017.
You might have thought this would be extremely bearish for the price of light crude oil. Greater supply leads to falling prices, after all.
Yet as it so often seems to, the reverse happened. Oil headed higher almost non-stop for more than two months after the announcement was made.
But now it seems to have hit a hurdle. Given that this is one of the most important commodities in the world, I want to take a look at where the price is likely to go next in today’s Money Morning…
A potential trade on a rallying oil price
That IEA announcement pretty much marked the low. Over the next two and a half months, the price of light crude (as measured by the West Texas Intermediate – WTI – benchmark) duly rose nearly 20% from $84 a barrel to $98 by the end of January.
That phrase ‘buy the rumour, sell the news’ is ringing my ears once again. We should all have it taped to our computer screens, or some other conspicuous place. It’s a great warning flag for when a particular market gets gripped by excessive expectation.
However, oil has now turned down, falling about 10% in the last two weeks. It saw a double top at $98, and has now fallen to about $90 – just as the Dow Jones Industrial Average broke out to new highs.
I have illustrated the recent action in the chart below.
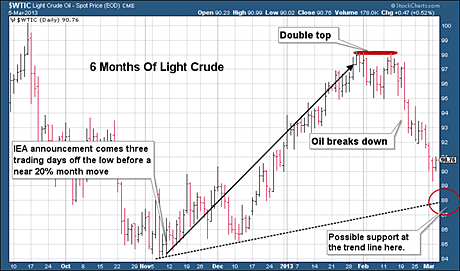
The question we must now ask is: ‘Where will the current fall end?’
Light crude staged a mini-rally yesterday, but I’m not holding my breath. One possible line of support is on that dotted black trend line I have drawn. If that doesn’t hold – and I’m not betting it will – then I suspect we will give back all of the recent gains and head back into the $84-85 zone.
I have drawn some areas where I see support on the three-year chart below. One in the $85 area; two around $75; three just below $70; and finally, with the dotted blue line, at $65.
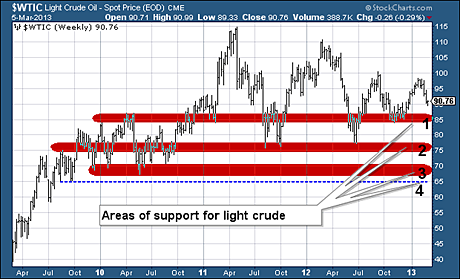
I would be very surprised to see us back at $65 any time this year. Anything can happen, of course. But buying at $84-85, with a stop just below that red band, at say $81-82, seems a decent gamble to me.
If this doesn’t work you might try the same trick at the second red band in the $75 area.
The pattern of many markets over the last three years has been for them to trade in increasingly narrowing ranges. I have written about this in both gold and sterling in recent weeks. We can see the same thing happening in light crude.
Here is a chart of it since its historic low in 1999. I have drawn a red trend line off the 1999 and 2009 lows. In dotted red lines I have shown how that range is narrowing. On this log chart – which measures the percentage gain on the Y-axis, rather than price gain – that narrowing range is even more distinct.
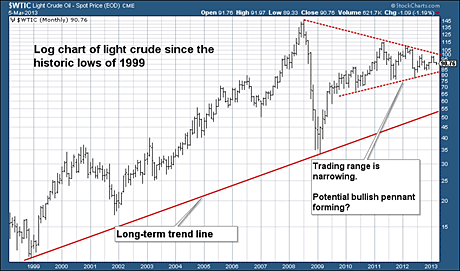
If you follow chart patterns, you might also see a ‘bullish pennant’ forming. Such a pennant – or a flag formation – is seen as a continuation pattern, representing a pause in an on-going bull market. The market makes a big move (1999 to 2008), pauses and consolidates at these higher levels, then heads on up in its merry way.
What technical analysis is useful for
This sounds banal, but my experience with such formations is that they work when they work, and they don’t when they don’t. The reason I like them and find them useful (and this probably goes for all technical analysis methods), is because they help manage risk and identify points at which to place entry and exit points, stop-losses and so on.
That long-term chart of light crude, for example, furthers my belief that a bet on oil at $84-85, with a stop just below the dotted line (perhaps at $81-82) might prove a good one.
Fairly soon that pennant formation is going to be broken. The way that oil breaks out of it – above or below – should be a good indication of its long-term direction. But given the chart patterns, not to mention the inflationary practices of central bankers and the simple fact that oil is getting harder and harder to find, and, finally, the current indifference towards oil among speculators and investors (it’s all about the stock market, folks), I suggest that long-term direction is going to be up and very much so.
Finally, I appeared with Merryn Somerset Webb and James Fergusson and the new Moneyweek TV show. Why not take a look? Yours truly comes on at 14:25
Category: Market updates