With all eyes on the chancellor’s autumn statement this afternoon, today we consider the fate of the pound.
What next? Up? Down? Sideways?
Read on and I’ll tell you…
The pound looks set to fall against the dollar
We’ll start with ‘cable’ – the pound against the US dollar.
Before I get into the near-term nitty-gritty (and that picture is not a pretty one) I’d like to put things, as I often do when on this subject, in long-term context.
Below we see cable since 1986.
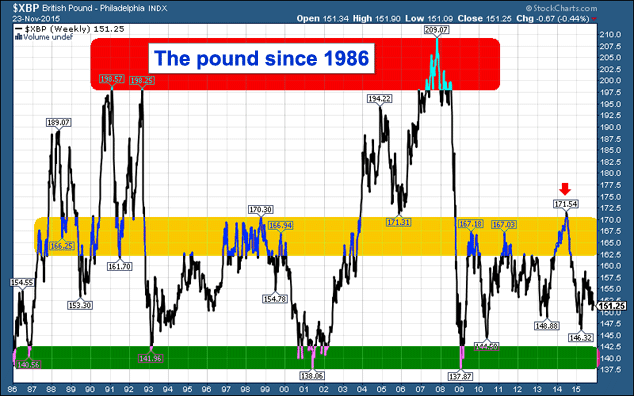
The red band at the top – roughly speaking, in the $2.00 – $2.10 area – marks the point at which, as Gandalf says to the balrog, the pound “shall not pass”.
“You don’t get poor selling the pound at two dollars”, runs the saying. Well, you might have done in 2006/07, if you lacked the courage of your convictions. In the financial bubble blow-off top prior to the debt crisis of 2008, we got to $2.10. But it’s a maxim that, for the most, part works.
Similarly, the point of maximum despair – the depths of the chasm to which Gandalf, the balrog and cable fell – is marked by the green band in the $1.37 – $1.40 area. The only time we’ve been below there in my memory was during the miners’ strike in, if I remember rightly, 1985.
In other words there’s a major floor at $1.37 – $1.40. The pound is a huge buy there.
The amber band marks the midway point of resistance and support. We’ll go above that in times of dollar weakness, and remain below it in times of strength – such as now. The dollar is in a bull market and, at $1.51, we are sitting right in the middle of the lower range.
Point to note: placing bets when we are right in the middle of a range is not always a good idea. We’re right in the middle of the ‘it-could-go-either-way’ zone.
But looking at the two-year chart, we can see a clear and worrying trend. And it is pointing down.
The moving averages – whether short- or long-term – are all sloping down (I’ve drawn the one-year (red) and 55-day (in green) on this chart. And the price is sitting below them.
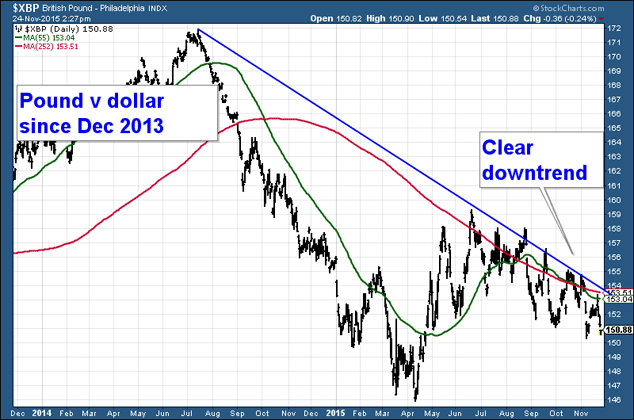
There is also a strong trend line off the summer 2014 high, drawn in blue, which is pointing lower. Every time sterling rallies to it, it bounces down.
Each high is lower then the last, each low is lower. Everything is screaming ‘down’.
The post-election bounce – actually it started a couple of weeks before the election, from April to June of this year – looks rather anaemic in the context of the broader falls since summer 2014.
So my short-term outlook: I see a lot of support at $1.50. There’s a lot of price history there. But I suspect this trend, which is, to be fair, mostly about US dollar strength, may carry us back towards those lows at 1.48, and even those lows at $1.46. But that would be quite an extreme level.
A rate rise in December from the Federal Reserve could get us down there.
But I think there would have to be some kind of panic to take us back to the green band and $1.40.
Can the pound break out against the euro?
Against the euro, however, the story could not be more different. The pound is trading near the top of a multi-year uptrend. Not since before the financial crisis has the pound been this strong.
Below, we see the euro since 1999.
I have drawn a broad amber band in the €1.37 – €1.45 area. From 2003 to 2007 the pound found support there. In the financial panic of 2007-08 it fell through.
But in the past year we’ve made our way back to that range.
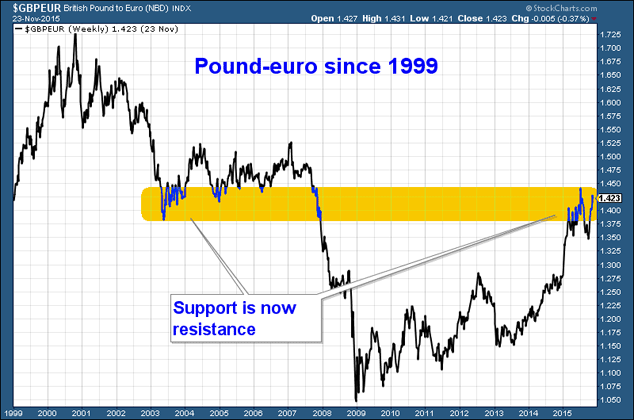
There’s a lot of similarity to the $1.45 – $1.50 area I drew on the US dollar chart above.
There is price history in this €1.37 – €1.45 range. This current rally could very easily peter out here, and we could trade sideways for many years. On the other hand, if we burst through, there’s no reason that we can’t get back up to the €1.70 area in a year or three. Then we’d need to be thinking in terms of “Nobody gets poor selling the pound at €1.70”.
But for now the trend is up. Very much so. In the interests of equal representation, here is a two-year chart.
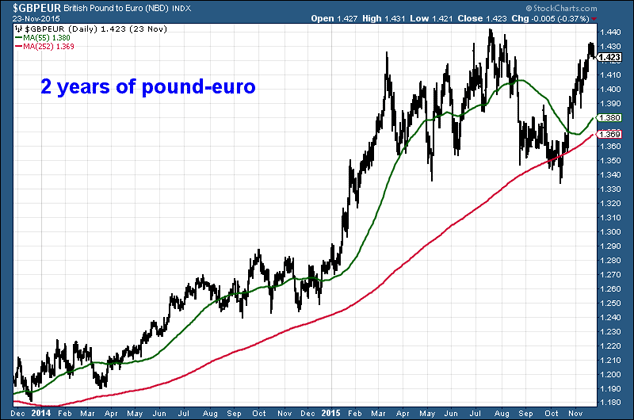
The red line is the one-year moving average, the green is the 55-day. Both are sloping up. As you can see, the trend is very much up.
Sure, we could put in a double top at €1.44. The euro is very cheap. We could retrace a bit before the next leg up. Nobody knows. But momentum is saying higher.
If these two trends continue – dollar stronger, euro weaker – the euro is going to end up looking insanely cheap against the dollar, and that is going to have all sorts of effects on world trade. The euro is going to look so cheap that the cost of EU regulation might actually be worth paying for international businesses.
But the pound, meanwhile, remains piggy in the middle. Much like the UK, really, on a number of different levels. Perhaps that’s why, politically, there is so little clarity on the EU issue from those in charge.
My colleagues at MoneyWeek magazine will be trying to provide a bit more clarity on that front with their next issue – out on Friday.
Category: Market updates