Oil has been off my radar of late. But there have been some headline-grabbing announcements in recent days that made me want to take a look at it today.
Did you know that, thanks to improvements in production techniques – think ‘fracking’ – US oil production has just risen to its highest level in almost 18 years?
And on Monday, the International Energy Agency (IEA) forecast that the US will overtake Saudi Arabia to become the world’s biggest oil producer by 2017.
My colleagues will be looking at the various implications of all this in the next issue of MoneyWeek magazine. But this morning, I’d like to ask – what does all this mean for the oil price?
Why hedge funds are selling oil
The best known oil price benchmarks are probably West Texas Intermediate Crude (WTI) and Brent crude. WTI has historically traded at a slight premium to the North Sea’s Brent. It’s lighter, sweeter and contains less sulphur, so it costs less to refine.
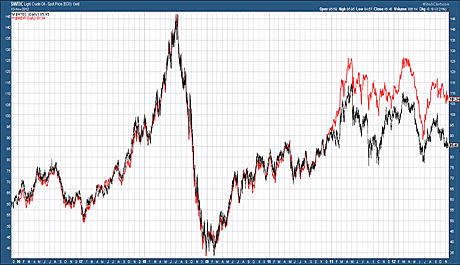
This changed, however, at the beginning of 2011: Brent actually rose as WTI fell. Brent now trades roughly 25% higher than WTI. Having hit a high of $109 a barrel in February this year and a low of $78 in June, WTI is now trading at about $85. It’s fallen about 15% since mid-September.
Brent, on the other hand, hit a high of around $125 a barrel in February. Its low for the year was about $90. And it hasn’t even fallen 10% from its September high of $115. It now sits at $107.
This chart shows WTI in black and Brent in red since 2006.
(Click on the chart for a larger version)
There are several reasons for the divergence. Over the past two years, improved production techniques in the US and better pipelines from Canada have meant more oil has reached refineries in America’s Midwest. This has driven prices lower. There has been no such increase in supply from the North Sea, so the price of Brent has remained stubbornly high.
These horizontal drilling and hydraulic fracturing – ‘fracking’ – techniques, which have made fuel in deep underground rock formations suddenly accessible, seem likely to have a very significant impact. Chief economist of the IEA, Fatih Birol, believes the US will overtake Russia as the world’s biggest gas producer by 2015. By 2017, it will become the world’s largest oil producer.
That’s a pretty dramatic turnaround – production from states such as Oklahoma, North Dakota and Texas had seemed in interminable decline. It’s little wonder that hedge funds have cut bullish bets on oil to a two-year low, according to Bloomberg.
But are they right to do so?
Rising oil supply versus rising money supply
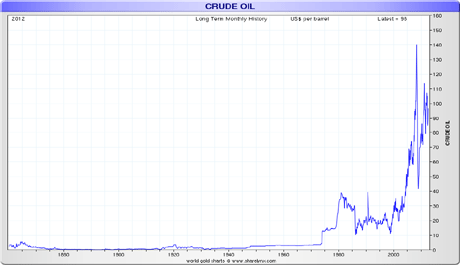
One problem that few seem to consider in the oil market is the issue of currency depreciation, and how it clouds the pricing picture. Let’s look first at 150 years of the oil price, courtesy of Nick Laird of sharelynx.com.
(Click on the chart for a larger version)
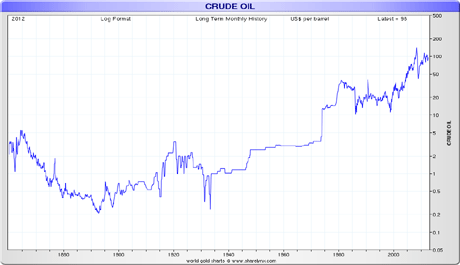
The price rises are so violent, you need to look at a log chart to keep things in perspective. The trend higher is relentless.
(Click on the chart for a larger version)
I’d draw your attention to two periods in particular, which saw huge rises in the oil price. There was the First World War from 1914-18 and the speculative commodities boom that followed it and ended with a bump in 1921. Then there was the inflation of the 1970s.
Both these periods followed the systematic debasement of money. First, we saw European nations leaving the gold standard in 1914 (not to mention the formation of the Federal Reserve Bank in the US in 1913). Then, in 1971, the US abandoning Bretton Woods and the last vestiges of the gold standard.
Given the debasement of debt (ie money) that is being pursued by policy-makers today, I suspect that further inflation is highly likely, if not inevitably going to appear in the oil price at some stage, despite the potential increases in supply.
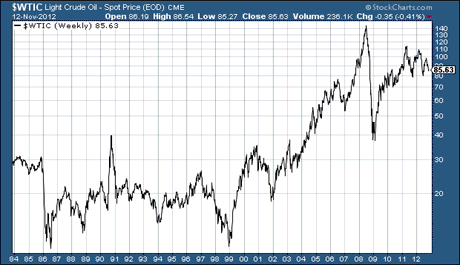
Here we see the WTI crude price since 1984.
(Click on the chart for a larger version)
Of note is that text-book ‘W bottom’ over 1986 and 1999. Meanwhile, the 2008 high of $148 a barrel still stands. But for how long?
For now, oil is a ‘sell’
In the short term, like all those hedge fund managers, I have a sell signal on both WTI and Brent. This is simply according to my own little trend-following system.
It’s a flawed system – I don’t pretend otherwise. It does not catch the extreme highs and lows of a move, and it’s not great during a range-trading, whipsawing market. But it makes sure you catch the main part of a trend should it occur. No system is perfect, but this one suits me.
I simply use the 21 and 55-day exponential moving averages. This means the average price of the last 21 and 55 days. Exponential means that the most recent days carry extra weight.
When the 21-day (green line) passes up through the 55-day (red line); both are sloping up; and the price is above both lines – that is your ‘buy’ signal. The reverse is your ‘sell’ signal. I have marked these on the WTI chart below.
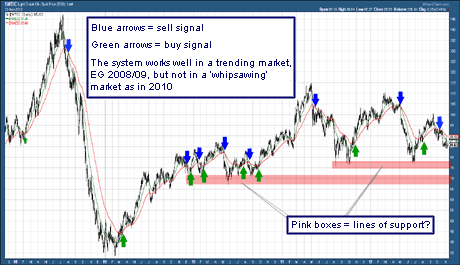
(Click on the chart for a larger version)
I would guess the WTI oil price is likely to find support around the $77 mark, where I have drawn the first pink box. If that fails, I see more support in the low $70s and at $70 itself, where I have drawn the second pink box.
Markedly below that I would have thought extremely unlikely, no matter how much they frack. (This issue is, I suppose, whether they can frack more than they print).
However, the beauty of technical systems like this – which is why I like them – is that what I think doesn’t matter. When the system says buy or sell, you act accordingly, and keep your opinions out of it. No matter how much research you do, you can never know all the facts, after all.
The trend for now is down – and trends can be powerful things. We shall see which is stronger. Those lines of support – or the trend.
Category: Market updates

