It’ll be a short note from me today, as I’m just off to write my segment of The Fleet Street Letter Monthly Alert… right after I finish today’s market broadcast with our tech investing specialist Sam Volkering.
Further to yesterday’s discussion of an “X-shaped” recovery, where some sectors fail and others boom, I want to know what he thinks will survive the current environment and what will perish. Sam has been writing extensively to his subscribers on what will thrive through these times, and I wanted him to share that with you. By the time you receive this, we shall have recorded it –
In the meantime, I’ve got something else for you today – a fresh perspective on the wild turkey shoot that is now the oil market. It’s a snippet from Akhil Patel’s latest work in his letter, Cycles Trends, and Forecasts.
Among the cycles Akhil studies are commodity cycles, and he often looks at oil as a gauge of where we are in the broader investment cycle. But in his latest piece, he notes that the advent of negative oil prices is unprecedented within the historical cycle of oil prices, and so investors need to trust the rhythm of the market instead, using signals as they come up. It’s a bit like navigating without a map, or playing a tune by ear – but I’ll let him explain what he means…
Back tomorrow,

Boaz Shoshan
Editor, Capital & Conflict
For charts and other financial/geopolitical content, follow me on Twitter: @FederalExcess.
Trading the market, not the forecast [excerpt]
Akhil Patel, Cycles Trends & Forecasts
… from the low in oil prices in early 2016, oil prices started trending up again:
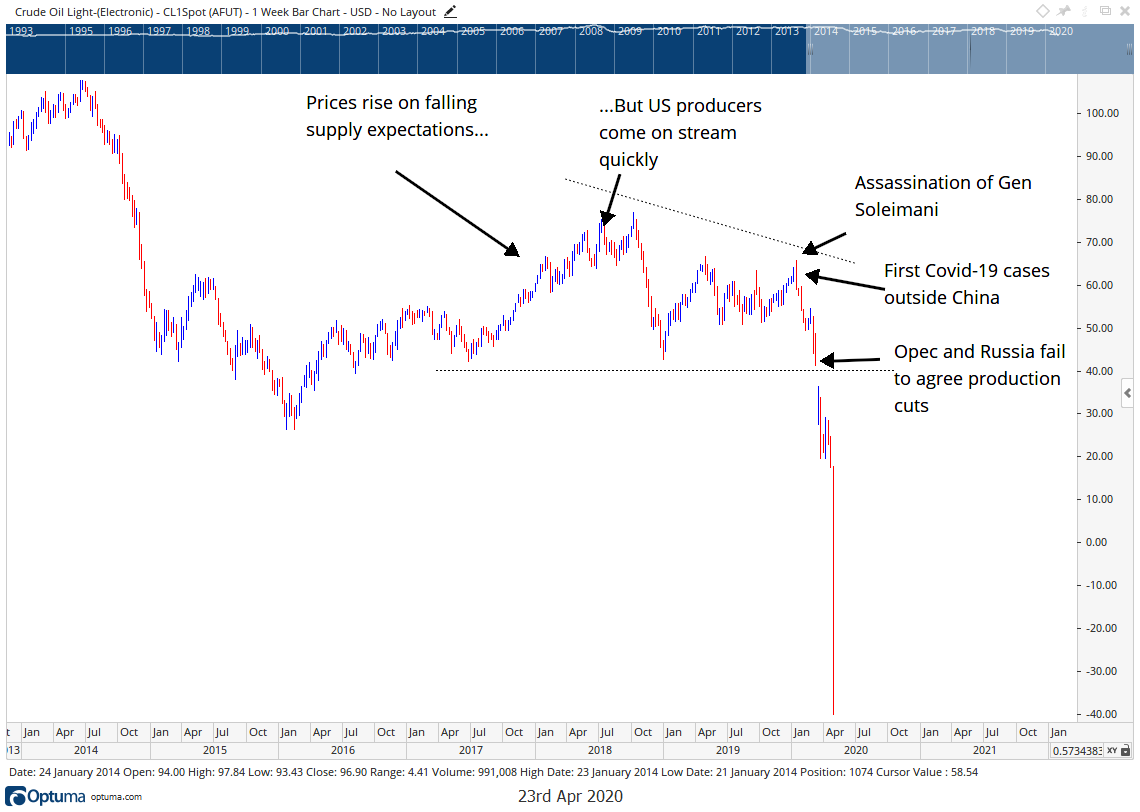
For a forecast looking for a peak at the end of the decade this was promising, not least because oil producers were only marginally increasing supply in response to rising prices, while demand was increasing again.
Similarly, the market was anticipating a few areas where supply was falling – Iran, because the US was signalling its intention to pull out of the Iran deal, as well as Venezuela and Libya, who for different reasons were dealing with major internal problems and disruptions to production.
The first warning sign however, came in 2018. Prices had moved up strongly in the first half of the year. But as they moved up beyond $50 and approached $60 per barrel, American shale production surged. In fact, by that autumn the speed at which American production ramped up meant the US was effectively the world’s largest oil producer.
And Donald Trump had made oil prices an election issue, in the run-up to the mid-terms. He complained about oil being above $60 per barrel.
This all led to a pretty swift fall in prices in early 2019.
Markets getting ready to surge do not fall quite so rapidly, with several weeks in a row of falling prices. They would tend to move more choppily, or even sideways, as investors read mixed signals. On the chart you’d start to see potentially markets “coiling”, as they got ready to spring out of a trading range.
Prices recovered to a certain extent during 2019 as the Saudis readied themselves for the much-hyped flotation of Aramco, even though not many people thought the anticipated valuation of $2 trillion was realistic with oil prices where they were and the new market dynamics at play.
Nonetheless, the flotation happened in December 2019 as oil prices moved up into the end of the year. In that sense my forecast was correct – we’d seen oil prices up into the end of the decade, out of mid-decade lows.
The next warning sign in relation to the forecast came in early January 2020, with the US assassination of the Iranian general Qasem Soleimani. This was the potential geopolitical shock that I’d been looking for that might lead to the same reaction, then or eventually, that repeated the surge in 1990.
Except that the event, and its immediate aftermath, brought a lower high in prices, well below the high in 2018 and even the 2019 high.
Looked at objectively, the chart was reading bearishly with a series of lower highs and a series of established lows at around $40 a barrel.
At this point, based on the cyclical repeat, if there was going to be an emotional year for oil, the chart was telling you that it would be because of a major downside move. And so it has proved.
In early March this year, OPEC and Russia failed to agree a production cut and that opened the floodgates, leading to a market rout in the context of what was going on at the mid- cycle recession and the policy response to the global pandemic.
There is now the possibility of further emotion in markets this year. Remember, the action in 1990 was a spike, which meant that the oil price came down within a few months of surging.
It’s possible we get something similar as production cuts take effect and demand returns with the easing of lockdown measures and a return to a degree of normality.
If that happens, oil prices would recover back to levels seen last year, around $60 a barrel. But this entirely depends on how much pent-up demand there is waiting to use up the massive glut we have presently.
We just have to see.
Of course, some of this dynamic is driven by politics and we now even have the sight of an American president wanting the price of oil to go up.
Because the US is now such a large producer of oil, and much of the industry is located in states key to his re-election chances, unlike 2018 when he wanted prices to stay low to help the American consumer, in 2020 he wants prices to go up to help the American producer.
An American president calling for higher oil prices! Now that’s something I thought I’d never see. Of all the “unprecedented” things we have had in recent weeks, I think that tops the bill. We live in very strange times indeed…
Category: Market updates