A couple of years ago, I attended a three-day seminar with the forbidding title “A Practical History of Financial Markets”. While 72 hours on financial market history may not be everyone’s cup of tea, to a student of market cycles such as myself, it’s a perfect way of delving into the past to trace the course of historic cycles.
The theme of this newsletter was inspired by something the course convenor, Russell Napier, said towards the end of the second day. By that point we’d spent almost two full days looking at valuation metrics for stockmarkets, how returns are affected by inflation/deflation, how asset prices are influenced by the liquidity in an economy and how investor decision-making is shaped by behavioural biases.
The rich content of this course was put together for the benefit of real practitioners who wanted practical insights based on the full sweep of financial history and who had a willingness to challenge financial orthodoxy to do so.
“We are still searching for a unifying theory…”
There was a real determination to try to explain several conundrums or questions that standard financial theory fails to explain, for example:
- Are stocks expensive? Are we in a stock and bond market bubble and, if so, what will drive its mean reversion?
- Why, in the face of such extraordinary monetary stimulus, is deflation a real possibility?
- How can US and European stockmarkets be so high, given that economic growth in the West is so low?
- What role does technology play in creating current financial conditions? Is technological innovation responsible for a “new normal” of low inflation/deflation, low interest rates, low growth and high asset prices?
While each individual expert had an interesting insight on some of these puzzles, what really got my attention was Napier’s admission that (I am paraphrasing here): “We are still lacking a unifying theory that ties together all of these questions and answers that we are considering.”
I was not entirely surprised to hear him admit that. If the financial commentary over the past few years is anything to go by, no one has really been able to connect the dots in a way that is satisfactory.
Here is the interesting thing, though: any study of financial markets over any significant period of history will inevitably focus on the major economic booms, financial bubbles and catastrophic busts about which so much has already been written.
But not once, during the three days, was land ever mentioned as the animating force behind massive credit expansions that fuel market bubbles and which eventually collapse into major deflationary episodes.
This was despite the fact that all of the incidences of bubbles we studied were preceded by significant land price inflation, including:
- Japan in the early 1970s, leading to a peak in 1974
- Japan and the Nordic countries during the late 1980s and 1990
- Hong Kong and Thailand in the mid-1990s, into 1997
- US in 1929, 1974 and 2007
- UK in 1973, 1990 and 2007.
Now, Napier’s course consisted of several different modules run by top quality practitioners managing billions in clients’ money and it was attended by bright and ambitious people working in similar firms. But the critical importance of land as a distinct factor of production, its importance to an economy and its impact on financial markets is totally missing from their understanding.
The more I study market cycles, the more I find how much of an edge understanding the real estate cycle gives you. But even more than this, it represents, in my view, the unifying theory that Napier said researchers are still searching for.
This is a big claim to make so let’s get stuck in. Before you do so, you may want to refresh your memory of how the 18-year property/land cycle, which I covered in Monday’s essay.
The key takeaway from putting land at the centre of your analysis: you will know for certain that the majority of financial and banking crises are preceded by a major land boom.
Banks play an important role in financing the boom and when the cycle turns over, often collapse. But the fundamental cause is land speculation. And this is not just in the US or the UK. In fact, in recent cycles, the really major booms and busts have often taken place outside the US and UK. The classic example in the last cycle was what happened to countries in the European periphery during the 2000s – Ireland, Portugal, Spain, Italy and Greece.
During the cycle before that, it was Japan and the Nordic countries. The real estate collapse in Japan was so severe that the economy went almost nowhere for the next cycle.
To understand the property market you need to understand the land market… but no one measures land prices
The property cycle is key for any real estate investor the world over, even if there isn’t the historical evidence of an 18-year cycle (as yet). While you may not see it in the chart of house prices, you are likely to see it in the price of land and the volume of land sales. The interaction of land and house prices also gives a clue to the presence of the cycle.
The problem is, however, that very few countries bother to measure land prices in any systematic way. Though pretty much every other variable in the economy is measured to quite amazing degrees of precision, the one that represents the greatest value is not. Yesterday, I went over why many economists may not feel it’s important: because land has been written out of economic equations.
However, I managed to splice together data from a couple of different sources to derive an annual estimation of land prices for England. (One of the data sources – the Valuation Office Agency – has stopped publishing land price data since 2010 so the data challenge remains).
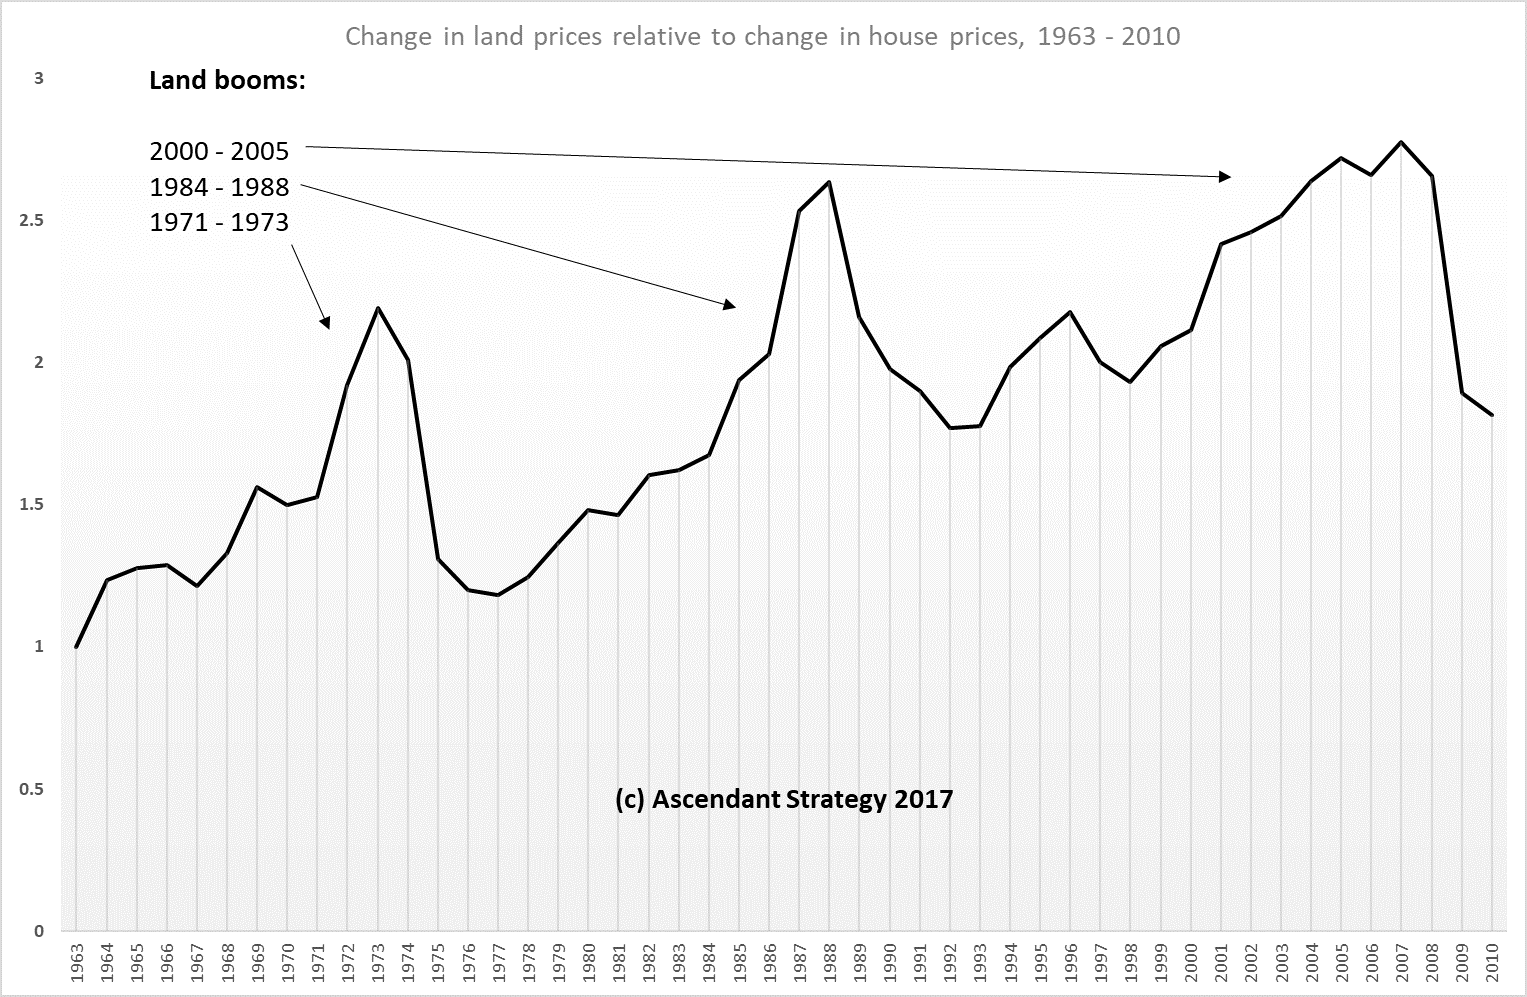
A simple comparison between the change in English house prices relative to the change in land prices between 1963 and 2010 yields the following graph. It essentially illustrates the major land boom in the run-up to each peak of the cycle, where house prices are themselves are not able to keep pace with an overheated land market.
This is at 13 to 15 hours on the real estate clock.
 Source: Ascendant Strategy
Land is the raw material for housebuilders. Many own strategic sites which they hold on to for years until cities expand and the sites become economically feasible to build out. Over the course of the cycle, as such sites get built out, they have to be replaced. But as the cycle moves forward, the price paid for sites increases and the rate of build-out increases.
When property prices are also increasing – especially as each new area experiences a surge in house prices as new buyers, priced out of adjacent areas, come in – housebuilders earn an excellent return on capital. This is also because the other cost inputs – labour and building materials – rise in line with broader inflation, and not nearly as fast as the finished product. This means higher earnings.
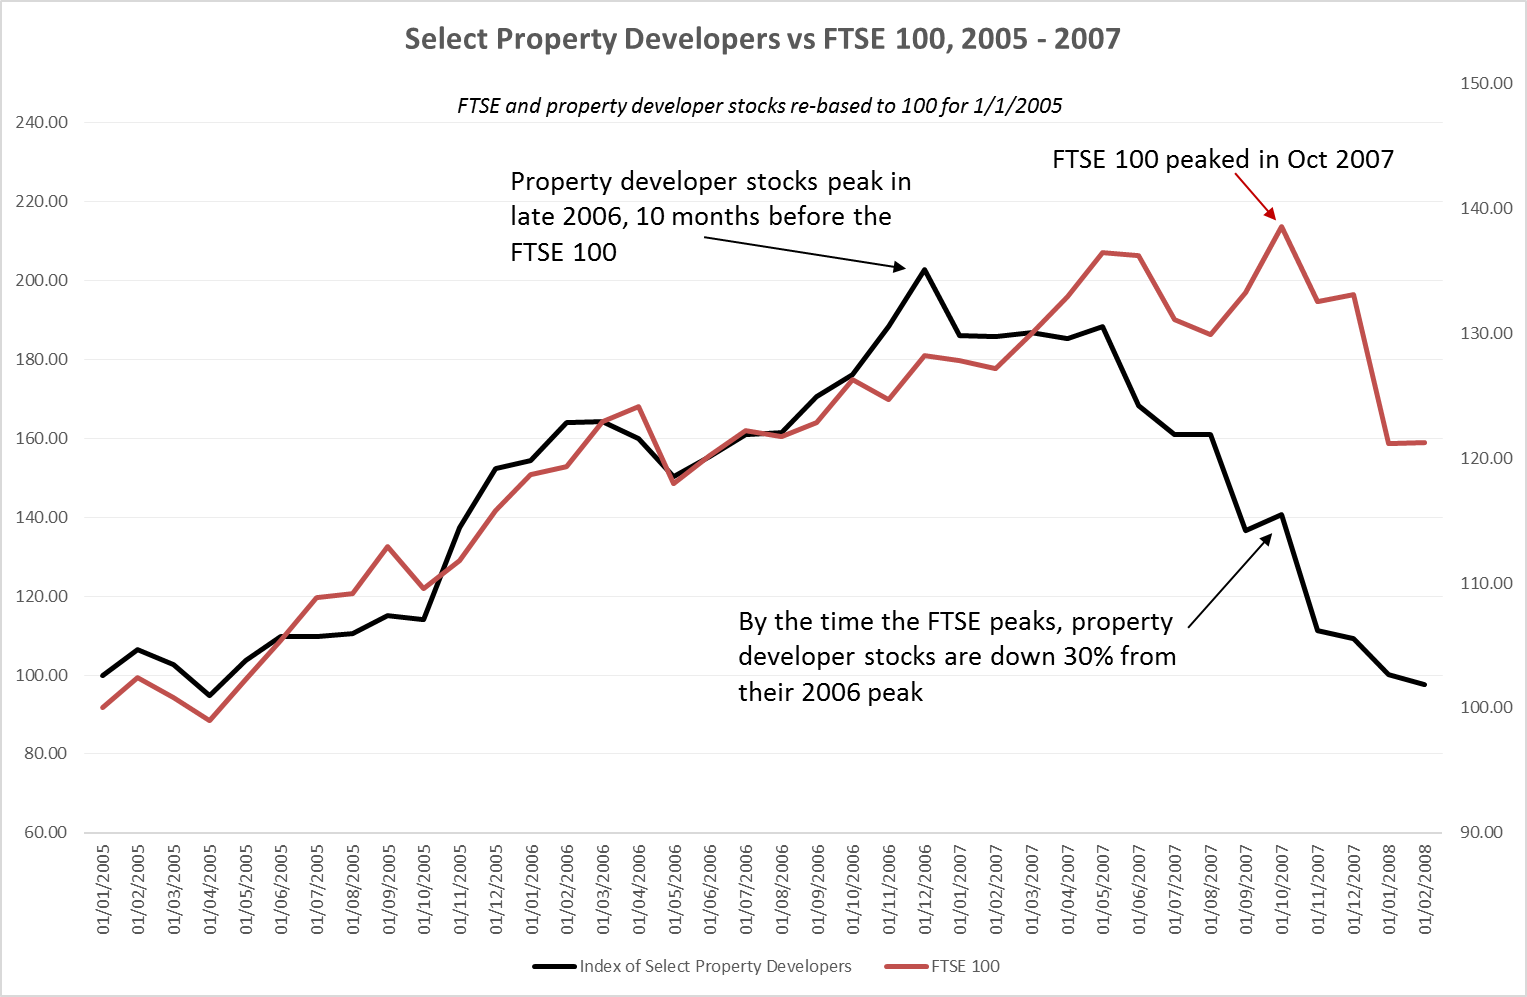
However, in the final stages of the cycle – particularly the “Winner’s Curse” phase (typically the final two years into the peak) – their margins start to get squeezed because the price of land is rising much faster than the price of housing.
For a time, this can be managed by cramming more development on to a site, or cutting costs by reducing build quality – or, if permitted, building higher. But eventually this will affect the bottom line. Stockmarket investors in housebuilding companies can see the decline in earnings’ outlook and will price this in.
This is the main reason that stocks of housebuilders decline prior to the peak of the broader market at the peak of the cycle. They provide an early warning indicator of the peak of the cycle and subsequent property (and stock) market crash.
 Source: Ascendant Strategy
This simple dynamic is key to investing in the property market. When land is cheap relative to the finished product, at the start of the cycle, this is the best time to be acquiring land or investing in property in other ways. Even if property prices have fallen, the price of land will have fallen further and so you have an automatic increase in return on investment.
You will also benefit from a lack of competition because many other investors will not be able to raise finance to support their investing or they cannot see the recovery in house prices that will take place. Labour and other material inputs will also be cheaper. So there are good profits to be made.
At the other end of the cycle, the reserve is true. Paying high price for land, even in a booming housing market, will present significant risks to your bottom line.
That understanding the dynamics of the land market is vital to property investing should, of course, not be a controversial proposition (even though many property investors do not fully recognise the importance of land per se).
The proposition that land is key to an understanding of financial markets, however, is likely to be questioned. But let me show you why it’s vital.
How land matters to financial markets
Financial market history is overwhelmingly concerned with the record of stock and bond prices. Consequently, it has little room for the real economy, other than by recognising the latter’s influence on variables such as growth and inflation, which in turn have an effect on financial returns.
Financial markets are so complex in their own right and involve the movement of trillions of dollars every year, so it’s perhaps not surprising that everything else should seem secondary in importance. But this is also the continuation of an intellectual tradition that corrupted economics from the start of the 20th century and which has influenced its derivative subjects of finance and investment theory.
Before the crisis, a cornerstone of the study of finance was that financial markets are efficient and that investors had rational expectations about the future (or that enough of them did so that they could earn arbitrage profits when other investors were behaving irrationally).
Nowadays, however, many accept that this might not be true; so the subject is preoccupied by investigating the extent to which financial markets might deviate from perfect efficiency or investors in them might behave irrationally. This is part of the search for why a seemingly unpredictable event of such magnitude as the global financial crisis could occur. I find this search for new answers quite interesting – particularly in the arena of behavioural economics.
But the danger is that this search will lead to complex explanations for what, in reality, is quite a simple and predictable process. And in so doing they will blind investors even further to what is going on.
The reality is that markets can operate efficiently and investors can rationally respond to price signals but the outcome is still one of periodic crises. Why? Because financial instability is the rational and invariable result of a system where the economic rent is privately captured and speculation in it becomes the main preoccupation of financial markets.
The stockmarket is small change compared to the real estate market. In fact, you can add the $100 trillion global bond market to the $80 trillion global stockmarket and the total is still significantly less than the $217 trillion global real estate market.
And because changes to inflation, the actions of central banks, the volume of lending by the banking system and a host of other actions of importance to the stock or bond investor respond to or result from what is ultimately going on in the land market, the real estate cycle is a vital piece of knowledge in the investor’s armoury.
Are stocks expensive?
During the course we spent a lot of time discussing whether stocks were expensive or normally priced and the metrics to determine this. Over the very long term, stocks will return on average 6.7% per annum in real terms. But your realised returns depend on whether or not you buy stocks when they are expensive or cheap, relative to underlying corporate earnings (which is ultimately what gives a share its value).
Markets sometimes go over the top and investors pay over the odds for a given level of earnings; at other times stock prices are depressed and a savvy investor might get the same level of earnings cheaply. So you need to know whether stocks are expensive or cheap – and if they are expensive, the argument goes, you need to wait until they are cheap.
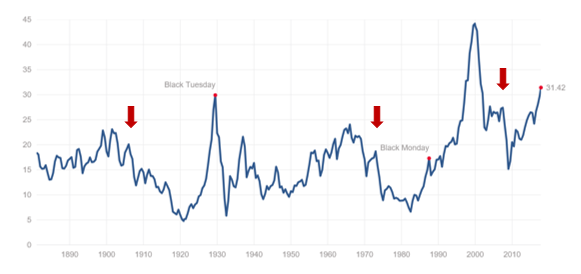
One of the most important metrics to help you with this judgement is the price-to-earnings ratio (P/E) or one of its variants, the most widely used of which is the cyclically adjusted price earnings ratio, or CAPE (also called the Shiller P/E ratio after academic Robert Shiller at Yale who brought it back into fashion some years ago). The CAPE is based on a longer view of earnings: an average of the prior ten years’, in fact.
The current CAPE for the S&P 500 stands at 31.42. The number buy itself is not terribly meaningful: but, as the graph below shows, this is a historically high amount – in fact, the last time the CAPE was this high was just before the Great Depression (and the 90% crash in the Dow Jones) or in the run-up to the dotcom bubble peak and subsequent market crash. For this reason, many investors are concluding that stocks are expensive and that the market overall is close to levels where it could crash significantly.
That’s all well and good. But markets have actually crashed when the CAPE was lower – in 1907, 1973/4 or 2007-09 for example (pointed out by the red arrows in the graph). The significance of these dates I will come to in a second.
 Source: multipl.com
The limitation of this measure for valuation is that it looks at historic earnings rather than future ones; but when you buy a share today, you are really paying for a share of earnings tomorrow. Of course what a company earned in the past few years is relevant to what it will earn in the future.
But at the present time, the past ten years of earnings will include the effect of the collapse in US corporate earnings between Q2 2007 and Q4 2008. During this period, these came down by 90% in real terms. From mid-2019 the effect of this plunge will disappear from the CAPE and the earnings side of the equation will appear healthier in relation to prices.
In fact, a rough calculation suggests that should earnings between now and end 2019 remain the same in real terms, stock prices would have to increase by 8% per annum in real terms just to maintain the same level of CAPE. In nominal terms, this would mean much higher index values.
For this and other reasons, my view is the CAPE at 31.42 tells you that… the CAPE is at 31.42 and not really a lot more. If this is the only reason you think that stocks are expensive, then I think you need to use other evidence.
Stockmarkets ride the real estate cycle too
And this is where the real estate cycle comes in. In the following graph below, I have taken monthly Dow Jones data back to 1800 and divided them into 18-year segments based on the key cycles dates for the US and then combined each segment to give them an average stockmarket pattern across every 18-year cycle. If stockmarket movements were totally random, then you’d expect more or less a straight line, following the overall trend of growth in the market.
 Source: Ascendant Strategy
But the pattern is far from straight. What you end up with is an average line that looks a lot like the movements of real estate prices through the course of the cycle – two halves of growth, lasting around five to seven years, interrupted by a mid-cycle slowdown, with the second half stronger than the first. At the end of the cycle you get a major market crash.
(The crash at the end of the cycle in the graphic above may not look that dramatic but that is due to the fact that not all cycles are precisely 18 years and the crash at the end of the longer ones – including the 90% fall in the Dow Jones after 1929 – were not included in this calculation.)
But at the end of the cycle, the fall in stocks is a significant wealth-destroying event. The median fall in the Dow Jones, going back to 1800, is 48% at the end of the cycle.
Between 1900 and the present day there have been ten bear markets in the Dow Jones where the index fell more than 40%; setting aside the falls that took place in the run-up to (or during) the two world wars, there was only one instance where a correction of that magnitude did not take place at either the mid or end of the 18-year cycle – the stockmarket crash in 1987. And even this correction took place very close to the peak of the cycle in 1989.
The other corrections – 1901-03, 1906-07, 1919-21, 1929-32, 1973-74, 2000-2002 and 2007-09 – all took place at either the mid-cycle or the end of the 18-year cycle.
In other words, the major bull and bear periods in stockmarket history follow the course of the 18-year cycle. So, if you’re an investor awaiting those periods when the broader market is going to “mean revert”, so you can load up on cheap stocks, CAPE is not going to help you identify when that will be. You have no choice but to know where you are within the 18-year cycle.
The quantity of money, asset prices and the real estate cycle
One of the most compelling modules on the course was on the “Quantity Theory of Asset Prices” by John Greenwood, the chief economist at Invesco.
The premise of this approach to looking at asset prices is the idea that the key variable in an economy is not interest rates, or the price of money, but the quantity of money. Banks create money through their lending activity (for a detailed discussion of this, see the April issue of Cycles, Trends and Forecasts) and this can lead to excess (or deficit) of money, or liquidity, in the economy. This in turn will influence prices of assets because some of this money will go towards purchasing (or selling) them.
Greenwood was able to demonstrate that in the run-up to prior economic peaks, there was a huge increase in the money supply, which fuelled the asset bubble. And he also made a point that I have argued at length in Cycles, Trends and Forecasts – that quantitative easing (QE), large in absolute terms as it has been, has barely replaced the money that was lost to most economies following the onset of the financial crisis. Hence the lack of economic growth and the low levels of inflation that persist in most advanced economies.
But as good as Greenwood’s assessment was, it missed one key ingredient – the thing that determines the quantity of money in the first place. For him, it was a vague notion of a change in monetary conditions brought on by a change in central bank or government policy that led to banks creating more or less credit.
But actually, in modern economies, the quantity of money created is largely to do with bank lending for real estate (land) – particularly for the acquisition of existing real estate assets. Around three quarters of the banking system’s money creation goes here. And, as economies develop, and as land takes the surplus, the amount of money created increases.
This is yet another reason why, in relation to GDP, the volume of private sector debt goes up. And, in the aftermath of the real estate collapse, why the cost of bailing out banks (who have lent profligately for real estate purchases in the prior boom) also gets larger and larger each time.
Since the money supply influences asset prices, investors need to look at what’s going on in the land market. During each land boom, the money supply increases and asset prices go upwards. During the downturn, money is lost because not only do banks stop lending but businesses and households deleverage – this causes a significant shortfall in the money supply, which exacerbates the recession and causes the collapse in asset prices
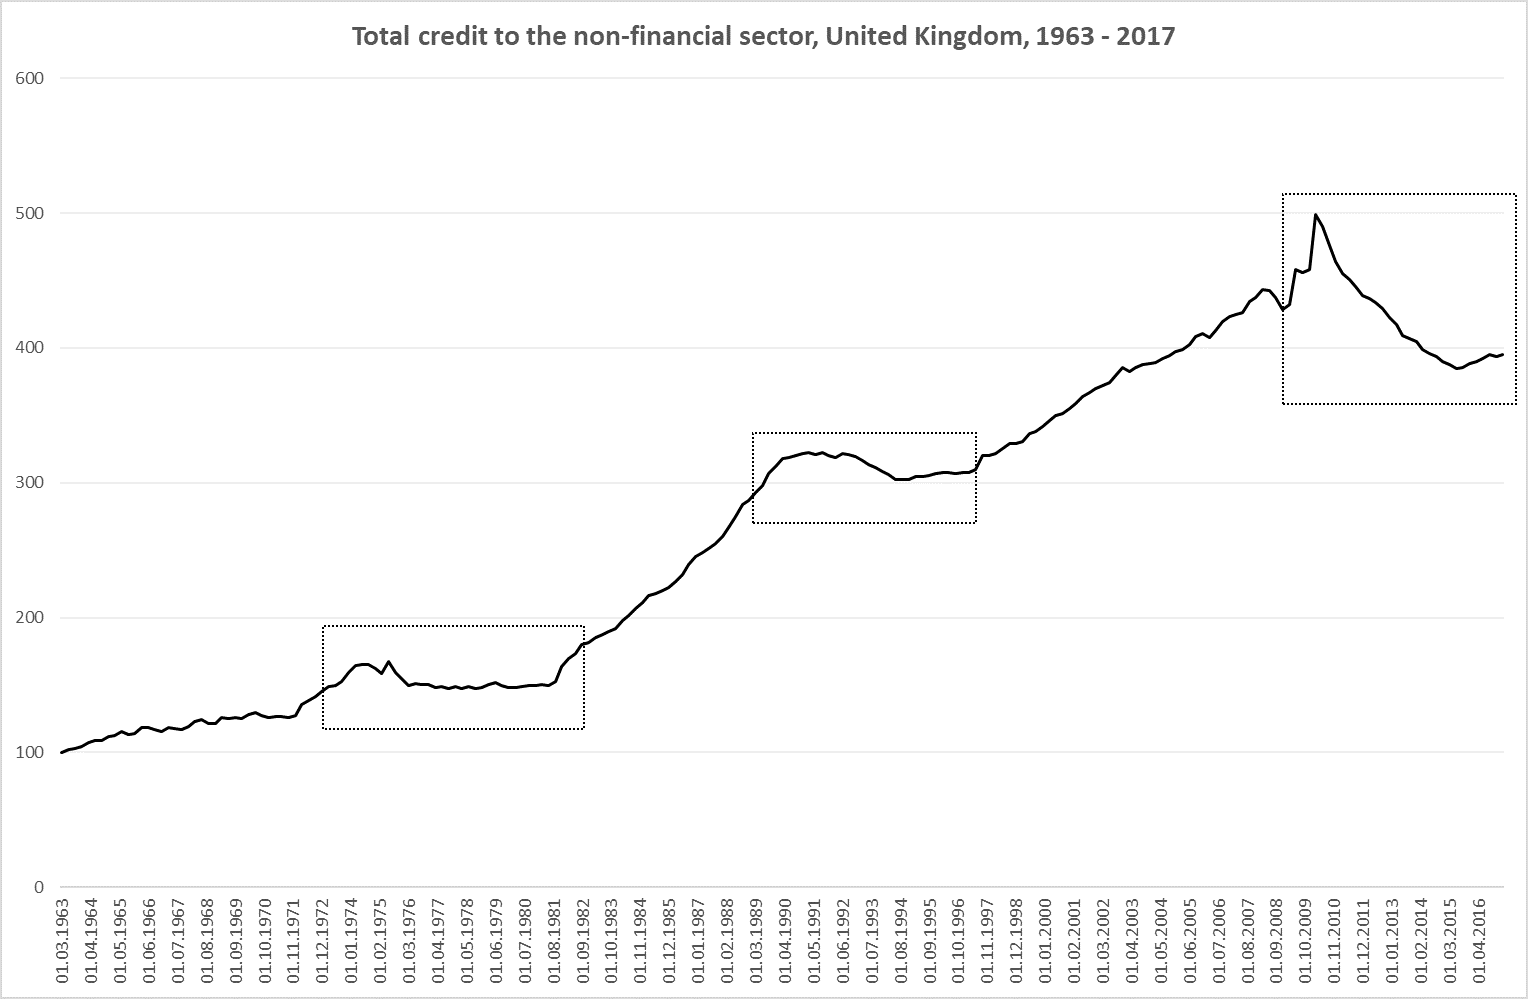
Below is a chart of growth in private credit to non-financial corporations for the UK since the early 1960s – in other words, the main components of the money supply. Note how the dips in money supply in relation to UK GDP coincide precisely with the end of the last three UK real estate cycles – in 1974, 1990 and after 2008.
During each of these credit contractionary episodes, the FTSE All Share index fell by: 73% in 1972-1974; 25% in 1989 (though this was very soon after the larger fall in 1987 of 37%); and 49.7% in 2007-2009.
 Source: Ascendant Strategy; Bank of International Settlements
It is during credit contractions and deleveraging episodes that concerns about deflation come to the fore. This, too, is strongly linked to the land market because the biggest deleveraging episodes can only follow a real estate boom and bust.
Capital cycles and overinvestment, electric vehicles and the glittering corporate HQ theory
The final presentation of the course was on capital cycles by Edward Chancellor of Marathon Asset Management and author of Capital Returns – Investing through the Capital Cycle: A Money Manager’s Reports 2002-2015.
He may be familiar to you as he has written in MoneyWeek magazine and did warn investors of a looming housing market bust in 2007. His approach, by contrast with other ideas presented at the course, was a bottom-up one: he looked at bubbles and crashes in stock prices through the lens of capital investment cycles within specific industries.
The capital cycle idea argues that asset price bubbles are fundamentally driven by excess capital investment. In a given industry – especially a new one – new entrants are attracted by high returns on investment. But this leads to increased competition, thus reducing returns; eventually the return on investment falls below the cost of capital. Investors will wake up to the fact that companies are effectively destroying shareholder value and share prices will adjust, often sharply.
The industry will then go through a period of consolidation as the weaker performers go out of business or exit the industry and investors are pessimistic. But this sets the conditions for a recovery because the businesses that remain are stronger, face less competition, their cost of capital is lower and therefore returns on investment are higher.
Chancellor believes that valuation metrics per se are useless because high valuations can last much longer than one thinks if the underlying level of capital investment remains reasonable. However, when you get high levels of capital investment and high stock valuations, the chances of a collapse – or mean reversion – is much higher.
This is an interesting lens with which to view the stockmarket. I asked Chancellor a question about how long he feels a capital investment cycle runs. His answer was that, after very exhaustive research, he’d not been able to find any regularity in their length.
But what this perspective fails to recognise is that, in the context of the overall economy, it is land that is the key driver of major capital investment and therefore the cyclical investment booms and busts. Hence, overinvestment in the semi-conductor industry (for example) is unlikely to bring down the whole market; whereas a massive construction and housebuilding boom is a possible sign that a banking and financial crisis is near – which will affect the whole economy. Ironically, it was the East Asian financial crisis in the late 1990s that inspired this capital cycle theory – which was in fact a land boom that peaked in 1997.
Below is a chart of fixed investment – both residential (red line) and non-residential (blue line) capital investment in the US from 1968 to present. It should be immediately apparent that the fluctuations in residential investment vary much more widely than capital investment in all other sectors in the economy (in aggregate). It also shows that changes in residential investment tend to move down and up before capital investment in non-residential sectors.
 Source: Federal Reserve Bank of St. Louis
To the extent that capital investment cycles affect stock prices, investors need to look at what’s going on in the housing market.
Chancellor made a couple of observations that I thought were relevant to the current market that you might find interesting. He said that the biggest capital investment story at the moment was the rush to build electric vehicles – there were so many large and small players trying to get a piece of the action that this was an industry ripe for overinvestment, asset bubbles, collapse and consolidation. This is something I will explore in a later issue.
It will be interesting to see to what extent this coincides with the key turning points in the overall 18-year cycle.
The other, equally pertinent, observation was his view that a sign that a sector is going over the top in terms of its capital investment and is facing declining marginal returns is the development of a fancy corporate headquarters. In that regard, the fact that all of the largest tech companies are doing this very thing, at a cost of several billion dollars, is important news – Amazon in Seattle, Apple in Cupertino, Facebook in Menlo Park and Google in Mountain View and London. You can read more about their glitzy (and over-the-top designs here). As we move into the latter stages of the bull market into the mid-cycle slowdown, this appears to represent quite interesting timing.
It seems, as with everything else in the economy, even for the largest tech companies, that it always comes back down to the land.
A Nobel Prize?
In my view, an understanding of the land market is a unifying theory that links disparate and hard-to-explain/predict features of our financial system – why massive monetary stimulus might be accompanied by the real threat of deflation; why expensive stocks can go hand in hand with low growth in the economy; and why a construction boom is a more important indicator for the stockmarket than, say, a boom in mining – or even tech – stocks.
Russell Napier said that the person who identified this unifying theory would be awarded the Nobel Prize.
If anyone from the Nobel Prize selection committee is reading this, I am waiting by my phone!
Tomorrow, we are going to change tack and look more closely at the idea of time and natural cycles – and how they can be used to identify key turning points in the market.
Best,

Akhil Patel
Guest Editor, Capital & Conflict
Category: Market updates