Over the last three days I have written a lot about land and economic cycles. (By the way, if you want to access my work on an ongoing basis for a big discount, just use this link.)
Anyone who studies such cycles cannot help but come across the remarkable consistency with rhythms you see in financial markets and those you see in nature.
But this is puzzling. How could the entirely man-made financial markets have anything to do with what goes on in nature?
The short answer is I don’t know – other than to offer the explanation that human beings are more closely linked to natural cycles than they think. And in financial markets – where every second of every day human beings are making decisions based on emotion, principally fear and greed – the sum of human activity seems to bear an intriguing correlation.
Let me explain what I mean, and how I use this understanding to guide my readership in Cycles, Trends and Forecasts. Today, I am reproducing a newsletter I sent out to my readers just after Halloween last year.
Celebrations and the annual cycle
This has been a big week for festivities and fireworks with Halloween, Bonfire Night and Diwali all falling in the same week.
I pay particular attention to what’s happening in the markets at times like this. Celebrations seem to coincide with significant turning points in the year – and because they mark key points in the annual cycle, they are important to financial market.
I know what you’re thinking: how can these have anything do with markets?
Let me show you what I mean.
The night when the dead walk the earth
In our globalised era, Halloween is celebrated the world over as (mainly) children, dressed in ghoulish attire, come knocking on doors to obtain sweets, or treats, from neighbours. It’s all a bit of fun, right?
But the rituals associated with Halloween are quite ancient and originated in the British Isles. The modern practice is a strikingly similar reprisal of what people used to do during the Druid festival of Samhain.
But Samhain (pronounced sah-win or soh-win) means “summer’s end” and actually marked an astronomical event: the end of the summer half of the year.
In the Earth’s orbit of the sun each year there are four key points – the two solstices (around 21 December and 21 June) and the equinoxes (around 21 March and 21 September). These divide the Earth’s cycle around the sun into four quarters coinciding with the four seasons of the year we experience on our planet. Religious festivals the world over marked or were related to these points in the year, including Easter, Holi, the Feast of St John the Baptist, the Harvest Festival and, of course, Christmas.
For the Celts, though, these four seasonal points were less important. Those points simply marked the high point of each of the seasons. More important was the beginning and end of each season, which fell at the mid-points, or cross-quarters, between each solstice and equinox.
Samhain fell on one of these mid-point days.
Tradition has 31 October as the date for Halloween. At that time Halloween was adopted the Julian calendar was in use and was out of step with the seasons. But the true date for it was around a week later, close to the actual seasonal mid-point or cross-quarter date.
Halloween thus marked the mid-point between the autumn equinox and the winter solstice. For the Celts, this mid-point also signalled the start of winter and hard times ahead.
There are four mid-points in all and each was celebrated in some way. In addition to Samhain there was Imbolc (2 February), Beltaine (1 May) and Lughnasa (1 August). All these festivals and celebrations happen roughly mid-way between the equinoxes and the solstices. That allows the circle of the year to be divided into eighths.
Note that we have just passed another seasonal mid-point – the early summer festival of Beltaine, which in England was traditionally marked by such rituals as dancing around a maypole. These were fertility rites, celebrating the start of the growing season.
The following diagram illustrates this.
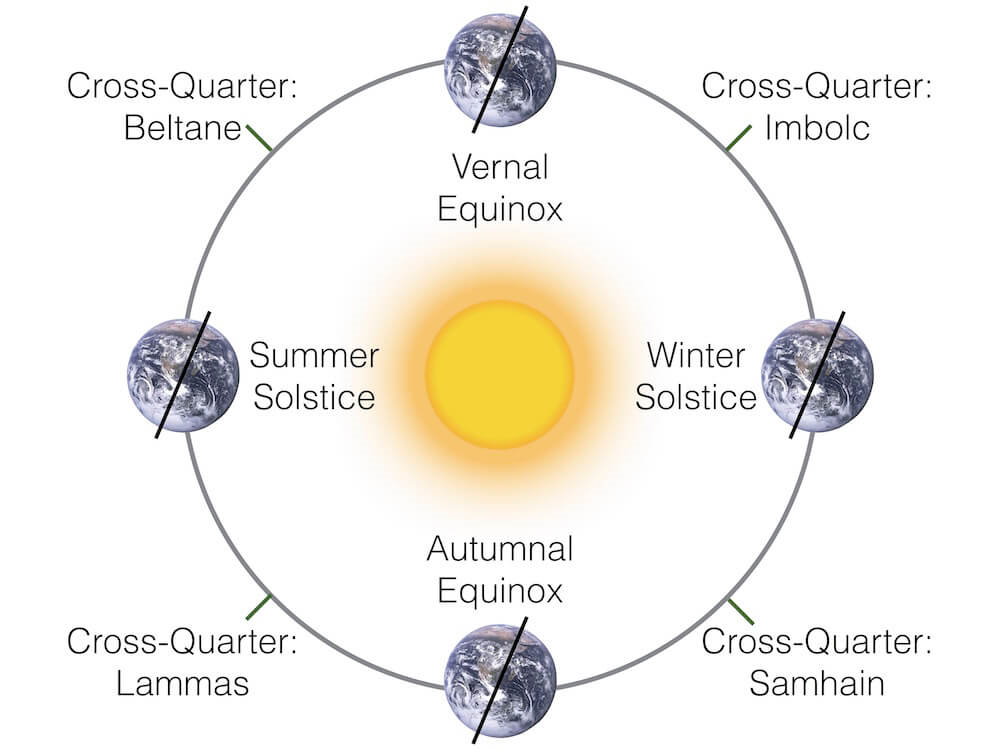 Source: Experience Astronomy
Of all the mid-points or cross-quarters, Samhain was considered the most important. For the Celts, Samhain marked the end of the year. It was considered to be a time when the boundary between the worlds of the living and of the dead was at its narrowest point – and at Samhain the spirits of the dead were said to have wandered into the world of the living.
To keep the dead happy, people would leave food and offerings – treats – outside their homes on the night of Samhain. Nowadays, children dressed in ghostly costumes knocking on your door for treats replays this ancient ritual. Should you not have a treat to give, then you are not appeasing the dead and so you might receive a “trick”.
Eventually, the Catholic Church incorporated Samhain into the calendar so that people would observe Christian rather than pagan celebrations. The Christian holy days of All Saints’ Day (or All Hallows’ Day/Hallowmas) – celebrating the saints – and All Souls Day – honouring the dead – were aligned with Samhain, on 1 November and 2 November respectively. The night before Hallowmas was called All Hallows’ Eve, which is where we get the name we use today – Hallowe’en or Halloween.
So what does this have to do with investing you might wonder?
Seasonal dates in financial markets
To bring all this back to practical trading, we need look no further than the writings of W.D. Gann. Gann was a Wall Street trader who was one of the best researches of stockmarket cycles I have come across.
His forecasts are legendary – calling the Roaring Twenties bull market, as well as the 1929 peak that ended it, well in advance. He wrote books and sold courses to educate a generation of investors.
In his two-volume book — Truth of the Stock Tape and Wall Street Stock Selector, published by Lambert Gann — you can find his published 1929 annual stockmarket forecast.
The forecast contains a section with the title “Important Dates for Change in the Major Trend”. In it, Gann suggested we watch these mid-point dates. In fact, he said (with emphasis added):
If any stock makes top or bottom around any of these dates, you can expect a reversal in trend, especially if there is a sharp decline or a sharp advance around these dates: Feb. 8th to 10th, March 21st to 23rd, May 3rd to 7th, June 20th to 24th, August 3rd to 8th, Sept. 21st to 24th, Nov. 8th to 11th, Dec. 20th to 24th. These dates are based upon a permanent cycle which does not change. Important tops and bottoms are made in many stocks every year are based around these times. Watch the stocks that reach extreme high or low levels around these dates.
Both Gann and the Celts knew what they were talking about. Those dates are important times of the year. Take a look at the following chart of the Dow Jones Industrial Average over the past two years.
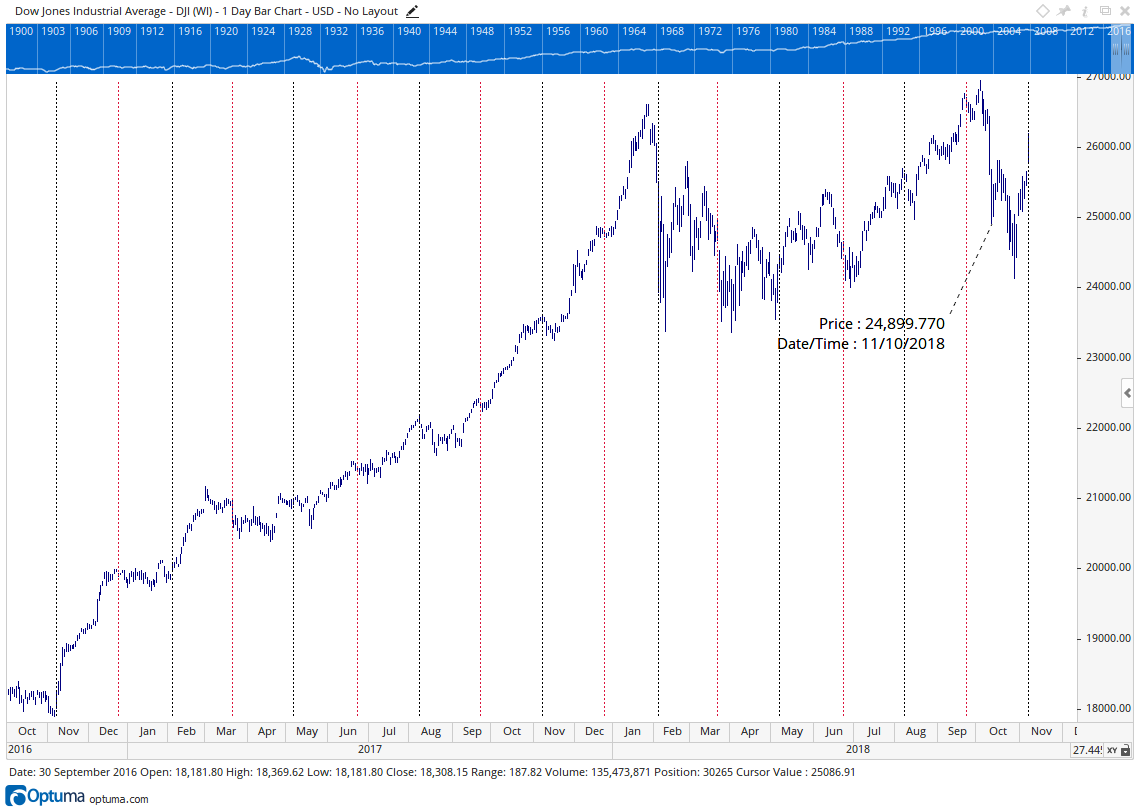 Source: Optuma
The red lines are the full seasonal dates (the equinoxes and the solstices), while blue lines mark the mid-point/cross-quarter seasonal dates.
Can you see how often, around each of those days or a day or two either side, the market changes, pauses or resumes a trend? Pretty much every single one of them influences the market in some way.
Gann’s advice was also to watch if the market moved very strongly into one of those dates. If it did, this was likely to bring about a strong change in trend – so they could be good buying or selling opportunities. I have looked into this further and have found that these can be good dates to initiate a position in a stock if you are trading with the prevailing trend, particularly where the market has reached an important price point (eg, a mid-point of a prior range).
Anyway, whatever you did on Halloween a week or so ago, remember that it all began because our ancient ancestors were watching the skies, marking the mid-point between the equinox and the solstice as the Earth circled the sun, and awaiting the end of an old season and the start of a new one.
Is there a causal link between natural rhythms and financial markets? If there is, I have not seen it set out clearly.
It doesn’t matter though – as long as they work. But financial markets are profound places to study such cycles because the data (price, volume, date) are totally objective. There is no hiding from what is in plain sight.
And while I am at it: the first part of the recent October sell-off was into 11 October (which I marked in the Dow chart above). This date is the mid-point of the mid-point. Or, to look at it another way: 11 October falls on a significant date if you divided the year into 16ths, halfway between the equinox and the early November seasonal date. This date in particular is often an important date for markets. For example, in October 2014, the market sold off sharply into 11 October (the final low came a day or two later).
But perhaps the most famous example of them all was the peak at 14,198 in the Dow on precisely 11 October 2007. It reached a level that day which it would not return to for almost six years. It truly marked the end of one season (era) and the start of a new one because by the time the market got back there in 2013, the world had changed forever.
Tomorrow, in my final piece, I am going to tie some of the themes together from this week and look at why we are moving towards the biggest boom of all time. If you think things have been excessive and over-the-top the past few years you haven’t seen anything yet!
Stay tuned.
Best,

Akhil Patel
Guest Editor, Capital & Conflict
Category: Market updates