‘Sell in May and go away, come back on St Leger’s Day’, runs the old stock-market saying.
St Leger’s Day (now Ladbroke’s St Leger’s Day, such is the modern way of things) falls on Saturday, 15 September this year.
Americans have modified the saying to suit their own calendar, recommending we go away ‘until Labor Day’. That’s the first Monday in September. This Monday coming, in fact.
Given that the Dow Jones has had such a heavy sell-off in the past month, diving back in next week might seem tempting.
But don’t. Here’s why…
September is historically a woeful month for markets
There have been all sorts of studies on the efficacy of ‘Sell in May’ – notably by the New Zealand academic, Dr Ben Jacobsen – and nobody can quite agree. Some say it works, some say it doesn’t.
And given the fact that the Dow Jones index has sold off by almost 1,000 points since its highs of early August, a September entry certainly looks very tempting.
But before you pile in, you should take a look at the chart below. It shows the average monthly gains and losses in the Dow since its formation in 1886. January, April, July, August and December (the tall green bars) are the stand-out months in terms of gains.
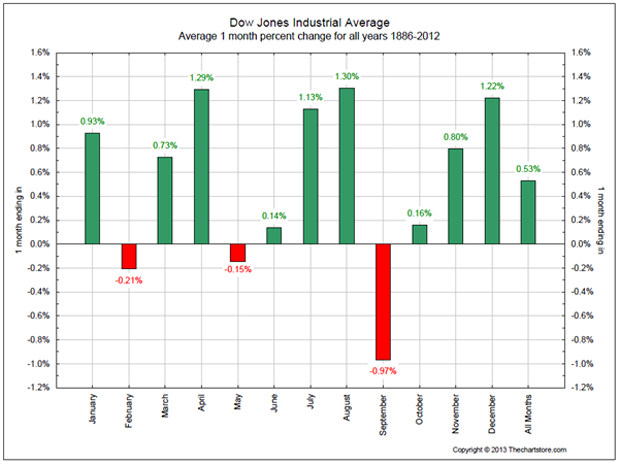
But in terms of losses, just one month really stands out: September. This is a market that has been (fairly) consistently rising over the 127 years since its inception in 1886. Yet even against that bullish backdrop, on average, the market has still fallen by 1% during the typical September.
This chart is saying don’t buy on Labor Day! That 1%, compounded over the years, could make quite a big difference to your portfolio.
Of course, this is more than a century and a quarter’s worth of data. It makes sense to consider a more recent time frame, so I’ll turn to the work of Dimitri Speck. His seasonal chart below shows how the Dow Jones has moved in an average year, based on data from the last 30 years. In a typical year, the best gains are seen from late October through to May.
Again we can see that September is, on average, a rotten month. If you’re going to buy in September, then you’re usually better off buying later in the month, rather than earlier.
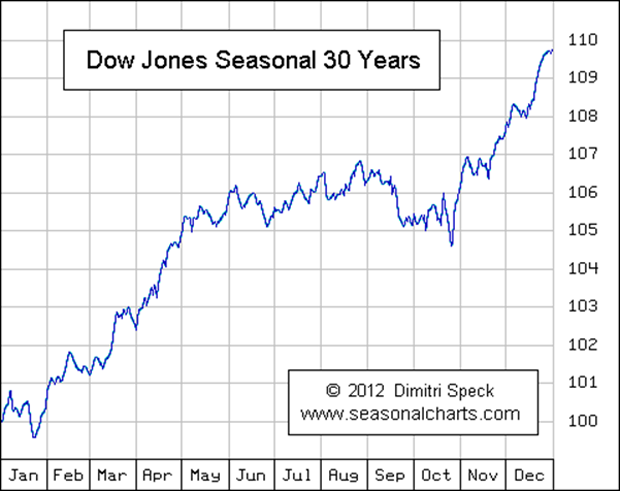
Indeed the inference is that we should wait out most of October as well – not least because October tends to be the stock market crash’s favourite month.
The Dow Jones needs to fall to at least 14,200
Another US variation of the St Leger’s Day trade is what they call the ‘Halloween indicator’. In this variation, you don’t re-enter the market on Labor Day. Instead, you wait until the last week in October, or the first week in November.
Now that makes sense to me. It leaves you in the market for the traditionally rewarding months: November, December, March and April. It leaves you out for the hazardous September to October period.
And it looks particularly sensible this year. From the Dow’s highs of 15,660 early in August, it’s down almost 1,000 points. On a short-term basis, that means the index looks very oversold. That sort of plunge, particularly in a market that has been as strong as the Dow this year, often leads to a bounce. We might see one of those any moment now.
However, it occurred to me that the Dow in 2013 has been on such a tear that it has not once gone back to its 252-day moving average (252-DMA). That’s its average price over the previous 252 trading days (there are 252 trading days in a year).
I had a look at a chart of the Dow over the last four years. In each of those years, it has returned to its 252-DMA. Then I looked at a ten-year chart. Then a 15-year chart. Then a chart going back to 1980.
The only year I could find when the Dow didn’t go back to its 252-DMA was 1989!
Here’s a chart of the Dow since 2000, with the 252 DMA in red. You can see, whether in bull or bear mode, every year the Dow goes back to it, if only for a brief period.
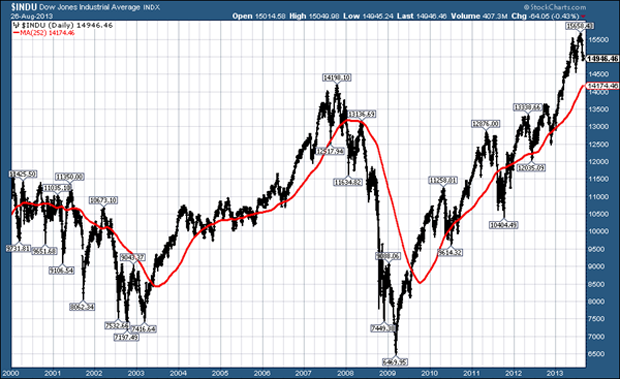
That 252-DMA currently stands at 14,174 and rising. That’s roughly the point of the 2007 highs, making that number an ideal target.
My money says we’ll revisit that red line before the end of October, perhaps even by St Leger’s Day (although I doubt it). That is to say, this correction will take the Dow Jones back to the 14,000 to 14,200 area, or perhaps lower at 13,500, before its next phase begins.
That would set the stage nicely for the ‘Halloween trade’.
Category: Market updates