In the eyes of some, it is the single most important price in the world.
There are those who have been predicting its imminent collapse for what seems like ages. And there are those who, for just as long, have been saying it is the go-to asset.
Yet for almost three years, the price has gone nowhere.
Today, we consider the price of the world’s senior currency, the US dollar.
The US dollar’s long, slow decline
We all know too well what the effects of low rates, quantitative easing (QE), dodgy measures of inflation and all those other ways by which money gets manipulated have been.
Asset prices (particularly those not measured by official inflation, such as stocks and houses) have been pushed up. Debtors, be they banks, governments or the heavily mortgaged, have been bailed out. And savers, the young and anyone who has neither debt nor assets, have been ‘priced out’.
It has all amounted to a huge and (in my view) unforgivable transfer of wealth.
But, no matter how much we complain about it over here, in many ways things have been worse in the US. Americans do not have our out-of-control and divisive property market. But at least our currency has been relatively strong.
The pound’s rally has meant imports and travel overseas have – on a relative basis – been cheap. You wouldn’t know it at the pump perhaps, but the price of West Texas Intermediate oil, for example, is the same as it was three years ago – if you measure it in sterling. Many other commodities are cheaper.
The US dollar, on the other hand, has been insipid.
Looking first at the long term, below we see the US dollar index, (the US dollar versus a basket of other foreign currencies) since 1980.
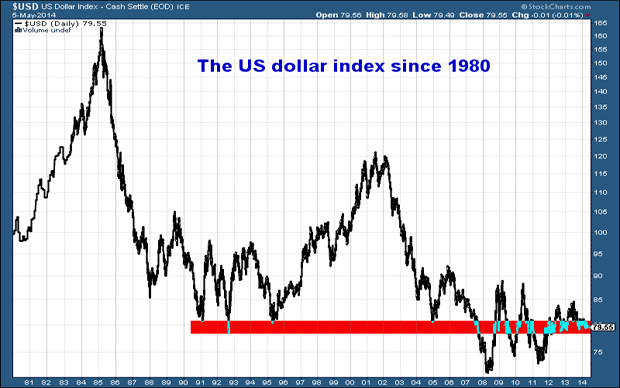
You’ll notice there are strong trends up or down that tend to last several years, which are followed by periods of whipsawing, sideways action (1988-95 and 2008 to the present day).
There have been two huge bull markets – 1980 to 1985, and 1995 to 2001. There have also been two huge bear markets that immediately followed the bulls – 1985 to 1991, and 2002 to 2008.
But the big story from the 1985 peak at around 165 to the present day at 79 has been one of major decline. That’s not necessarily what you want to see from a global reserve currency.
That 2000 peak at just over 120, by the way, is roughly equivalent to the level of the US dollar in 1971. This is significant, as this was a year in which the monetary system was completely reset: when the US came off the gold standard.
I also draw your attention to the red band I have drawn around the 79-81 area in the above chart. It seems to be an important price point. The US dollar found support there in the early 1980s, before setting off on a monster rally that peaked in 2000-2001.
Over the last three years it has been finding support there again and again.
But the more times a level gets tested, the less likely it is to hold. Are we getting set for further falls? Or are we putting in a base, rather like the early 1990s?
What happens next?
Let’s look now at the more recent action. The chart below shows the US dollar since late 2012. I’ll explain everything I have drawn on it in just a moment.
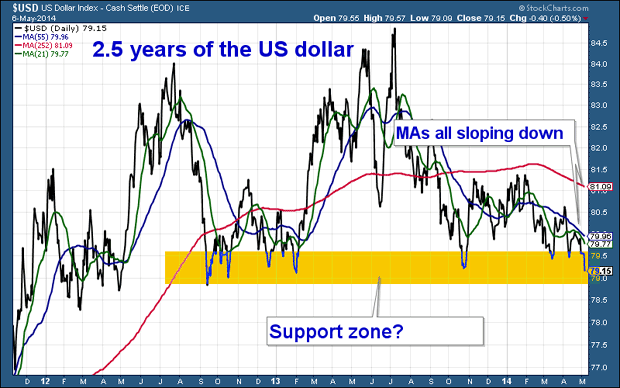
The black line is the actual price of the US dollar. Note the narrow range over the last two years or so – from just below 79 to 84.75.
The red, blue and green lines are simple moving averages. They show the average price of the dollar over the previous year (red line), 55 days (blue line) and 21 days (green line). The main point to note about them is that they’re all pointing down – I’ll explain the significance of that in a moment.
The amber box is drawn around the 78.8 to 79.5 area. This is where the dollar has repeatedly found support – buyers, in other words – over the last two years, before rallying.
Since mid-2013, the rallies have been getting smaller and smaller. Yesterday we re-tested 79.5 for the third time in two months. As I say, the more a level gets re-tested, the more vulnerable it becomes.
And yesterday, support failed. The dollar moved sharply lower.
As I noted above, all three moving averages have turned down, and the price is below them. This suggests that a downtrend is forming – reflecting the longer-term major downtrend pictured in the first chart.
Currencies tend to trade sideways for long periods before making rapid multi-month moves in one way or another. I get the feeling that we’re coming to the end of one such sideways period for the dollar.
The way the dollar moves out of it will have serious repercussions for just about any market you care to think of. For now, the price is heading lower. A break down below 78 would probably herald some inflation. But, more significantly, it will also get people talking. A falling currency – and all the accompanying noise – will increase pressure on the Fed to tighten monetary policy and raise rates.
If the Fed resists this and that downward trend picks up, those guys with the guns and tins, calling for the ‘death of the dollar’, might have the right idea. So far, they have a habit of being proved wrong, however.
For now, it seems that foreign currency traders believe that QE will never end, despite the slow and steady taper. I reckon we’ll see the US dollar continue to fall until the point at which that belief changes. Perhaps in the summer we’ll get a clear announcement of some kind – and if that involves QE ending altogether, the dollar will start to look cheap and should rally.
So perhaps over the next six months we’ll get one of those false breaks lower that puts everyone on the wrong foot, with the dollar plunging before a monster rally higher that does indeed come with end of tapering.
For the moment, that’s my base case. But we shall see. Whatever happens, the price of the dollar bears watching over the coming months – its next big move has major implications for all markets.
Category: Market updates