I hit a bit of a jackpot with my short trade of two weeks ago.
In today’s Money Morning, we review the trade, I try not to gloat, and I suggest a couple more ideas on the short side of the market.
That is to say – I think these stocks are headed down.
Let’s start with the winner
A couple of weeks back I suggested trendy US shoe-maker Skechers (NYSE: SKX) had got ahead of itself. I bet we’d see a correction and I described the trade I was placing.
Last Friday it announced its earnings. They disappointed. The stock fell from $45 to $29. A nice 35% drop. Bingo.
It could still fall further. At today’s price of $31, it’s still 75% above the $18 price that it began the year at. Blimey, it could fall back to its 2013 low of $5. But I’d suggest $25 is a not unreasonable next target.
I’ve taken a bit of money off the table and moved my stops up.
Fashionable shoes are a dangerous business for the simple reason that fashions change. The once trendy Crocs (Nasdaq: CROX) – remember them? – is a good example of what can go wrong. It was a $75 stock in 2007. It’s a $10 stock today. For all the bull market there’s been in US stocks, Crocs has ground lower and lower.
Some US stocks have gone up too much
There are plenty of other US stocks that I think have got ahead of themselves, and I’m going to share some of my ideas – many of which have made their way to me via my buddy, Dave Skarika, over at Addicted to Profits (thanks Dave).
The easiest way to play these is either by buying put options (only for the experienced) or via a spread bet (ditto). I stress: when shorting you can lose your shirt. You must make sure your risk is properly managed.
The reason this is all so US-focused – I know readers sometimes prefer opportunities closer to home – is that America, at least as I see it, is where the most over-valued stocks are.
Why America’s largest supermarket chain is a sell
So my first sell is Kroger (NYSE: KR). Kroger is the largest supermarket chain by revenue and the second largest general retailer in the US. It has a market cap of $36bn, it pays a dividend of 1% and is on a price/earnings (p/e) ratio of 19. I suppose a bet on it falling is akin to a bet on a slowdown in American retail, but that’s not why I’ve gone short.
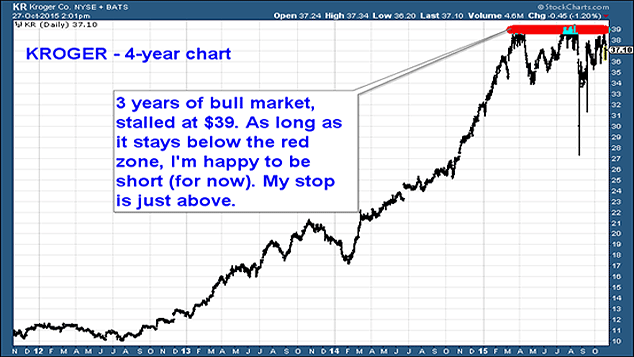
It’s almost quadrupled in price over the last three years – surely Americans aren’t eating that much more? – but it seems to have run into a wall at the $38-$39 area. The momentum has gone and there has been a MACD crossover sell signal. (MACD is a measure of momentum used by technical traders.)
The current price is $37. My first target is the $32 area, then $25 to $27.
In terms of risk management, as long as it stays below $40, I’m happy to be short.
Here’s a daily chart of the last four years. You can see the red zone at $38-39 where momentum has run out. If the price goes above that red area, I’m wrong and I’m out of the trade.
Short trades: Netflix is a sell too
My next idea, controversially, is Netflix (Nasdaq: NFLX). I signed up for Netflix earlier in the year and I think it’s really good, though the UK version is woefully limited in stuff to watch compared to the US version.
Sure, Netflix makes great programmes, it’s disrupting TV and, I read, it’s about to disrupt Hollywood. All well and good. That’s all priced in.
What isn’t priced in is the possibility that something else is about to come along and disrupt it. Nor is the possibility that one of its very many productions in development flops. Flops, as any Hollywood mogul will vouch, can be very expensive.
The current market cap is $42.6bn. The p/e ratio is 274 (LOL). It was a $10 stock three years ago, this year it hit $130. The current price is $102.
Here’s a one-year chart. I’ve defined the current trend with the two blue tram lines – which are pointing lower.
You can also see the 21- and 55-day moving averages (the dotted blue and red lines) are also pointed lower, and the price is sitting below them.
In short, the intermediate trend is pointing down.
There is, however, plenty of support where I have drawn that amber band in the $93-5 area. If this one breaks below there and, especially, below $80 – and there is a worrying gap between $70 and $75 that it might want to fill – then it could get interesting.
That said the price could quite easily hold at $95. So we need to think about risk management. Putting a stop above the August high of $130 is one idea – though that’s a bit loose for me. I’d probably go (and I’m not yet short of this one yet) somewhere around $120 – just above the recent highs and just above the current range.
I’ve actually got a list of about ten American stocks that have gone bananas over the last three or four years. Many of them are now breaking down. Even though the Dow, S&P 500 and Nasdaq may have had quite a run in recent weeks, the internals of the market are not looking as healthy as they did a year or two ago, when I was more bullish.
Something similar happened in 2007, when the indices pushed to new highs, even though many individual stocks were behaving badly.
We’re in a period of consolidation. What remains to be decided is whether this will resolve to the upside or to the down.
Interesting times. And fun ones!
Category: Market updates