We can feel proud and patriotic.
After many years of trying, our capital city has finally made it to the top of the charts.
According to UBS, London is now top of the Global Real Estate Bubble Index.
Bubbles have a habit of popping.
Is that what’s next for London property?
The real cause of unaffordable London property
I must say I was delighted to see that straight off the bat in their introduction to the 2015 UBS Global Real Estate Bubble Index, authors Matthias Holzhey and Maciej Skoczek make the link between loose monetary policy and unaffordable housing.
This is a connection those setting policy continuously, steadfastly and disingenuously fail to see. And it’s one that needs to be shown.
Those writing for The Daily Telegraph, The Guardian and other widely read broadsheets, as well as those commentating on the telly and radio, have also failed in this regard, declaring, naively, that the answer to the housing crisis is to build more homes.
Sure not enough homes are being built, those that are being built are undesirable and planning laws are a terrible barrier to progress, but the primary cause of unaffordable housing – and all the inequality that high house prices have created – is loose monetary policy: easy credit in the 2000s, then, post-2008, quantitative easing (QE), zero interest rate policies (Zirp) and all the rest of it.
A huge fat chunk of the money they printed – both here and abroad – has ended up in London property. QE and Zirp may not have caused inflation as measured by the consumer price index (CPI), but CPI ignores house prices, and that (as well as financial markets), is where the the inflation showed up.
Make no mistake: monetary policy has caused the housing crisis. The sooner those up top accept and act on this link between their monetary policies and unaffordable housing, the better for all concerned.
Just how expensive is London?
Houses currently stand at 15 times earnings. 3.5 used to be the norm. A skilled service-sector worker needs approximately 14 years of average earnings to buy a flat of 645 sq ft.
As for rents, the ratios are so distorted, the cost of buying a flat is equivalent to renting it for 30 years.
It’s a bubble. Bubbles pop. The question is when.
Say UBS, “Between 1985 and 2009, whenever the index… entered the upper half of overvaluation territory, a real price correction of on average 30% began within three years 95% of the time”.
Is that what’s coming to our capital?
Maybe. The current situation is one of atrophy and stand-off. Volumes have crashed – there is very little turnover – but prices haven’t.
But short London property at your peril. 1989-94 aside, London property defies gravity. The big financial lesson of my 46-years as a Londoner is, never sell London property.
Nevertheless, let’s look at some of the indicators and see what they’re telling us.
What’s next for London property?
We’ll start with everyone’s favourite estate agent, Foxtons (LSE: FOXT).
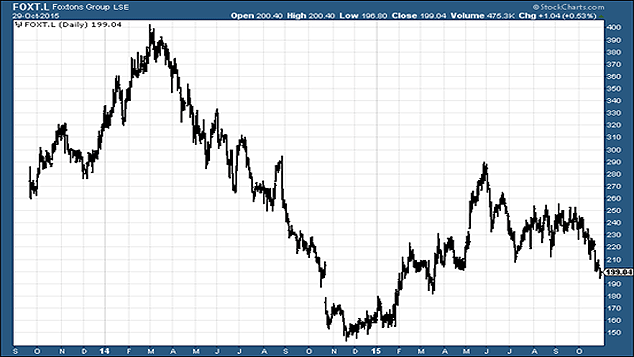
Foxtons has actually proved a useful barometer. The stock peaked at 400p in March 2014, a few months in advance of what appears to have been the peak in prime London prices. Foxtons then sold off right down to 142p.
It enjoyed a nice bounce, starting late last year, which took it back to 290p in June. Since then, the trend has been down. This week, it’s slipped below the 200p mark.
Here we see the price since its listing in 2013.
As things stand, I would not touch this stock, except on the short side.
Countrywide (LSE: CWD) has described a similar pattern and is also in a steady downtrend.
So, the estate agents are not auguring well for property. But it’s no surprise their stocks are in such bear markets. Turnover – how they make their money – has dried up.
Savills (LSE: SVS) is behaving rather more healthily I should stress. It’s less than 10% off its highs for the year. Though I’m happy to have a sportsman’s bet with anyone so inclined that that high – 990p – turns out to be a double top.
As for the builders…
So we move from the agents to the builders’ merchants and we consider the plight of Travis Perkins (LSE: TPK), which also owns Wickes. Why Travis Perkins should be a leading indicator needs no explaining.
The stock is up over ten times since 2009, and it’s almost tripled since the beginning of 2012. It’s had a great run.
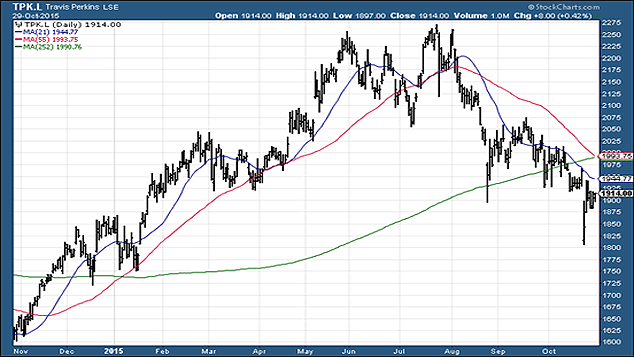
But history might show that great run ended, much like, I suspect, that of Savills, with a double top in June and July of this year – in this case at 2,250p. It’s now in at 1,914p.
It’s trading below its 21-day and 55-day moving averages, which are pointing down, and it’s also broken below its one-year moving average. It hasn’t broken that 20% fall mark, when you can declare something to be in a bear market, but the trend is down.
The builders, however, are looking much more resilient – in fact, compared to other areas of the stockmarket, they’ve shown good relative strength. Using Barratt (LSE: BDEV), Berkeley Group (LSE: BKG) and Balfour Beatty (LSE: BBY) as our lodestars, they all had a nice start to the year, and since the spring, they’ve been, give or take a few percent, pretty much flat.
But I should stress that the builders (Berkeley excepted) are not quite so London-centric. They are more indicative of the UK as a whole.
Perhaps potential buyers and sellers are waiting for George Osborne’s autumn statement to see if the government will further sponsor them through more help-to-buy, before they make their decision – hence this lack of clear direction. Given how Michael Heseltine-like Osborne is proving himself to be, I suspect more meddling is likely.
That said, Barratt looks dodgy to me. It’s sitting below it’s 21- and 55-day moving averages and they’re pointing down. I suspect the builders may have formed what is known as rounded top over the summer. So I am taking a small short position.
My broader thesis remains. The pin in the bubble of UK property will be newbuild in SW8. What remains to be seen is whether the contagion spreads. At the moment, the stocks are not auguring well – well, at least not for London.
Category: Market updates


