Our ride on the “₿ullet Train” continues. This sure as hell isn’t a sleeper journey – if you doze off on this ride it might wipe you out…
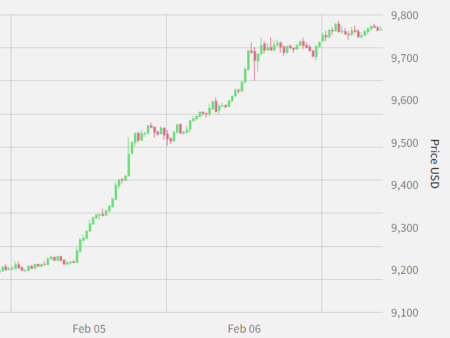
The bitcoin price over the last few days has been going at a pace that only the crypto market knows how to sustain.
The aggressive march it began on Wednesday looks set to arrive at the $10k station – indeed, by the time you get this it might already be there!
But does this mean you should be chasing the rally?
Charlie Morris’s answer may surprise you.
But his candid advice is no surprise to his readers at The Fleet Street Letter Wealth Builder –
I’ll leave you in his capable hands now, where he’ll show you another glimpse of bitcoin “under the bonnet” below.
Have a good weekend!
All the best,
Boaz Shoshan
Editor, Capital & Conflict
Bitcoin for the cautious (Part 2)
By Charlie Morris
A quick recap. In Part 1 I explained that the network value (NV) is the total value of the network. The amount of value that changes hands each week is called the transaction value $ (TV$), and the relationship between them is called the network value to transaction ratio (NVT).
This averages 6.8 weeks over time. A higher reading suggests that bitcoin is expensive and a lower reading suggests that it is cheap. As with stocks, buy low and sell high, but watch out for bear markets. It is critical that the underlying network is either growing or stable.
In Part 2, I will introduce you to transactions fees $ (fees) and network velocity (velocity). In aggregate, these give you three different ways of measuring network transactional activity. They all do a different job, and in aggregate, give a strong signal for when the bitcoin network is growing and stable and when it is not.
The point is that all of bitcoin’s losses have come when the network has been in decline. A cautious investor would want to know when the underlying asset is behaving well, and when it wasn’t.
The amateurs in the room look to social media “likes” and Google trends to measure the hype, whereas professional investors need to know more. It is useless knowing that thousands of people, with little money, are cheering an asset on from the sidelines. I would much prefer serious people were going about their business, in a quiet manner.
When I started looking for these metrics back in 2013, they were nowhere to be found. And that is why I founded a company to calculate them: ByteTree.com. This rich data source takes measurements straight from the blockchain, and in Part 2, I’ll start with fees.
Fees
When you transact in bitcoin, you pay a fee. That fee is currently less that $1, regardless of the transaction size. Those fees are collectively over $1 million per week. There are many reasons why fees exist, but principally to pay the miner who processes transactions. Without fees, they wouldn’t put in so much effort in keeping the network running smoothly.
Fees also disincentivise fake traffic. Imagine I have $100 million of bitcoin. Without fees, I could transfer that from my left pocket to my right pocket all day and make the network look busy. TV$ would show activity, but it wouldn’t be economically useful.
Fees are a huge disincentive to create fake traffic. A dollar may not sound much but if you wanted to boost the traffic from the current 2 million transactions per week, to 2.2 million per week, that would cost you $200 thousand each week, which would soon add up.
Fees are therefore useful for keeping fake traffic at bay. As it happens, you can send transactions without fees, and one day they will be processed by a miner, but there are no guarantees it will happen quickly. Fees are an alternative measure of network activity, beyond TV$ which shows the amount of value being transacted.
Bitcoin fees tend to exhibit string trends
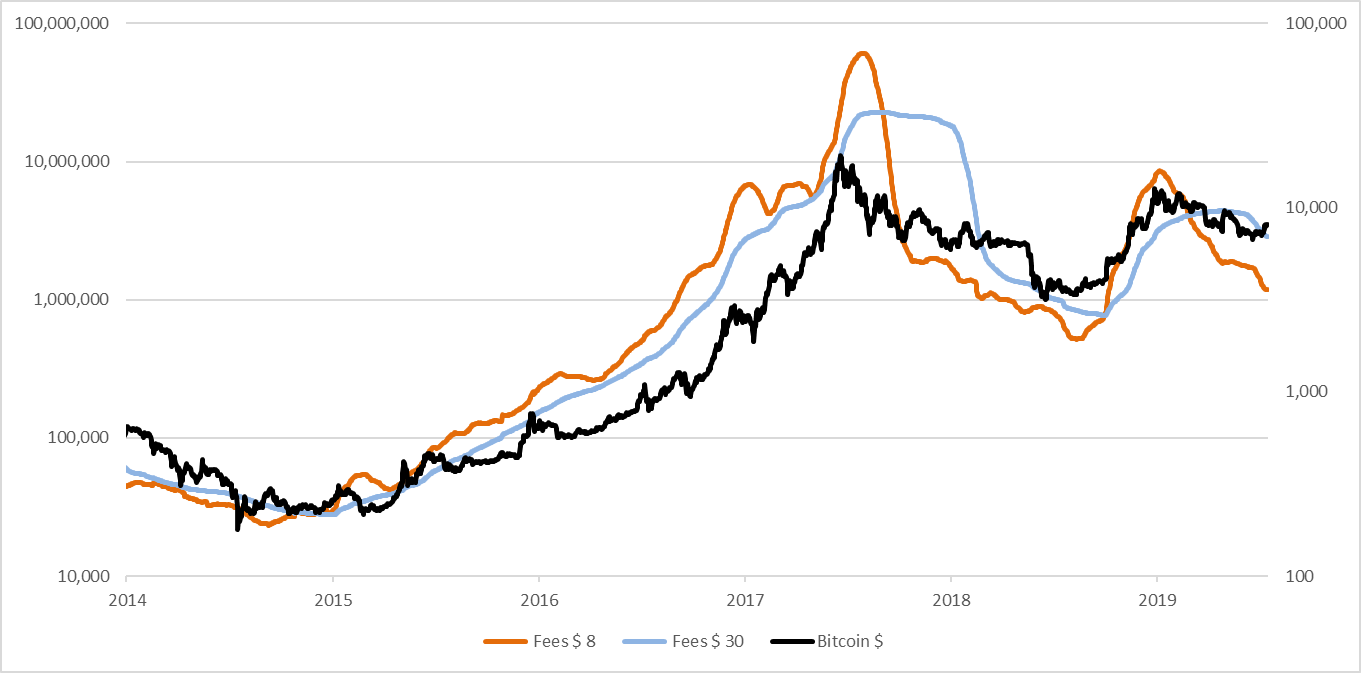
 Source: ByteTree.com – bitcoin $ (black rhs), fees per week: 8 weeks (orange lhs), 30 weeks (blue lhs) since 2014
The chart shows you the 8-week average and the 30-week average fees for the bitcoin network. This will be familiar to those who have used price-moving averages. When the fees rise, the orange line is quicker to respond than the blue line. When they cross over, that means the network is growing and the price will later rise, as seen in early 2015 when bitcoin was $200.
In early 2018, the fees started to decline and the orange line passed below the blue line, signalling contraction when the price was closer to a whopping $8,000. The bitcoin price then fell by 85%, which was an impressive sell signal.
There was a smaller trading opportunity again last year. The price was around $4,000 when the network showed positive signs and around $10,000 when it declined again. Fees are a very simple way to follow the network trend.
Velocity
Bitcoin velocity is a concept borrowed from economics. There we talk about the velocity of money. It looks at how rapidly it moves around the system. If it moves quickly, the economy is vibrant, and as it slows, the economy stagnates. The bitcoin network is no different.
Academics prefer this measure to fees, because it is a non-price measure. That means the speculative price has no impact on the calculation as we are measuring the number of bitcoins being transacted against the outstanding supply.
If 1.5 million bitcoins changed hands last week, then that equated to 1.5 times 52 weeks = 78 million bitcoins per year. There are currently 18.1 million bitcoins in existence (with an eventual cap at 21 million). That means a typical bitcoin is circulating 78 / 18.1 = 433% per year. Or approximately four times. Easy as pi.
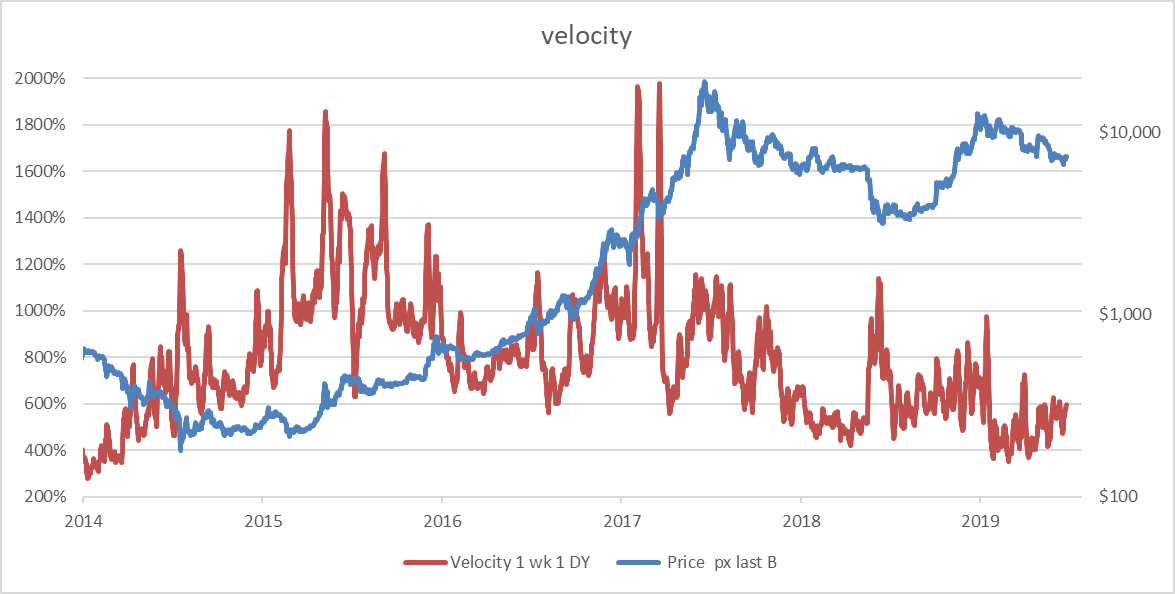
 Source: ByteTree.com – bitcoin $ (blue rhs), velocity (red lhs) since 2014
The link between velocity and price is nothing like as clear as fees or TV$, but it still gives away powerful signals. Notice how when the price is low, a high velocity reading is telling you that the network is alive and well.
Why? Well imagine you wanted to send $100. If the price is low, then more bitcoin is required to do so. If the price was low and the velocity was low, then the network would be dead, as you’d be one of the few transacting and no recovery would be forthcoming. But if it were high, then the system is still working despite the low price.
The natural cut-off seems to be around 600%. I have tested this in a number of different ways and 600% seems to hold. I can show you that in my next chart.
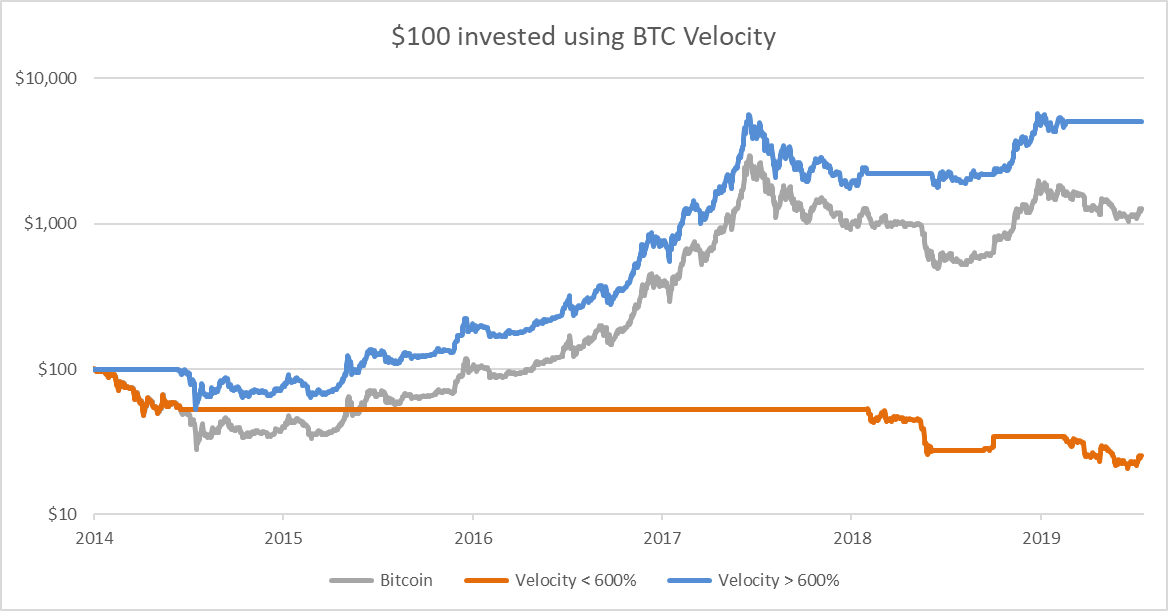
 Source: ByteTree.com – return on $100 invested in bitcoin (grey), bitcoin when velocity >600% (blue) and < 600% (orange) since 2014
The results are incredible. By investing in bitcoin when velocity is greater than 600%, you missed most of the bear markets in 2014, 2018 and today. Buy and hold would have turned $100 into $1,000, which is great, but the strategy of investing in a market with healthy velocity turned it into $5,000. Weak velocity, on the other hand, turned that $100 into $27.
It’s all about the network
Having dived into the world of cryptocurrencies back in 2013 and having overseen a cutting-edge IT project in the space, I can tell you that I’ve seen it all. The theories bandied around the space are normally nonsense with the latest fad focusing on halving.
That is in May 2020, the miners will receive fewer bitcoin for their efforts. There’s nothing wrong with that, and it’s all part of the plan, but many people believe it will cause the price to double. It won’t. Instead it has attracted a cult following and fuelled a ridiculous conversation.
Many others use technical price-based models which are hugely unreliable, especially when the underlying asset is so volatile. I guarantee you that there are no technical models that will come close to what’s possible from fundamental network analysis.
And that neatly brings us to today. Bitcoin is in a bear market, not a savage one, but there is no growth in sight. Add to that an NVT (remember that from Part 1) above 10 weeks, and there is no reason to buy.
Just as the price does horrible things when the velocity is below 600%, it does horrible things when the NVT is above 10. With a long-term average of 6.8, bitcoin is currently trading at $9,720, as I write, yet only worth $5,633.
You’ll save yourself a fortune by waiting until the next time the ducks are in a row – and I’ll tell you exactly when that is when you join me The Fleet Street Letter Wealth Builder.
Kind regards,

Charlie Morris
Editor, Southbank Investment Research
Category: Market updates


