Ladies and gentlemen, grab a drink. You’re going to need it.
Today marks a “major change in trend of monumental proportions”.
The government will start to lose control and the lurking monster that is excess debt will rear its head.
Today is the start of the sovereign debt crisis.
Chaos and political upheaval lie ahead.
Time to buckle in…
The uncanny predictions of Martin Armstrong
The above are the predictions of Martin Armstrong, the controversial American financial forecaster.
Armstrong’s story, which I’ve covered here before, is gripping stuff – money, conspiracy, government agents, crime, jail – and an uncanny ability to predict future events.
In the 1980s and 90s a unique forecasting model and a super-computer with “the largest economic database in the world” enabled him to become a wealthy globe-trotting investment manager.
But when he was implicated in fraud in the late 1990s, he refused to hand over his computers to US authorities. In 2000, he found himself locked up. He went seven years without trial – a record. In 2007 he pleaded guilty to one charge and was kept in jail for another four years.
As he soon as he got out, he went straight back to his forecasting. His blog, ArmstrongEconomics, is now among the 25,000 most visited websites on earth – no mean feat, given the specificity of his subject matter. Newsletter AtlasPulse wryly notes that this is “10,000 places ahead of Moody’s”.
Yet despite this interest in his work, he is largely ignored by the mainstream media – I suspect, because his methods are so unorthodox they’re too scared to give him too much airtime.
But what has captivated people are his uncannily accurate forecasts.
His model dates back to the early 1980s, but this is a slide he says he presented at the World Economic Conference in 1998. (I’ve been unable to find footage of that conference to verify this). If it’s genuine, it’s pretty mind-blowing.
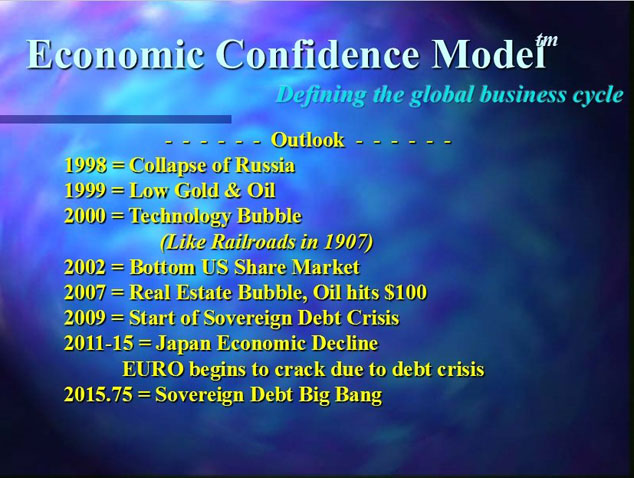
These were the major turning points in global finance. Following Armstrong’s road map could have made you a lot of money.
In fact, some of his predictions are even more amazing than that.
Here’s how it works
Armstrong’s forecasting model works as follows.
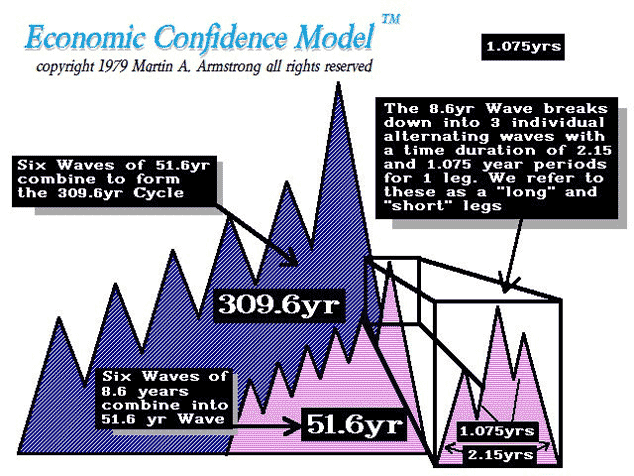
Based on economic cycles he has identified looking back as far as 6000 BC, he says there is a long-term business cycle of 309.6 years. This is broken down into six waves of 51.6 years (interestingly, the same duration as the more famous Russian economist, Nikolai Kondratiev’s famous cycle). Armstrong breaks this into six waves of 8.6 years each, which he also subdivides into 2.15- and 1.075-year cycles.
The total number of days in one 8.6-year cycle is 3,141 – pi times 1,000. Hence the model is also known as the ‘Pi Cycle’ (see below).
I sympathise with anyone who, reading this, dismisses it all as some kind of charlatan numerology.
On the other hand, the turn dates he has identified, sometimes decades in advance, often seem to coincide with significant global events and shifts in the financial landscape. Here is a chart (dated to 1997) with the turn dates from 1985 to 2020.
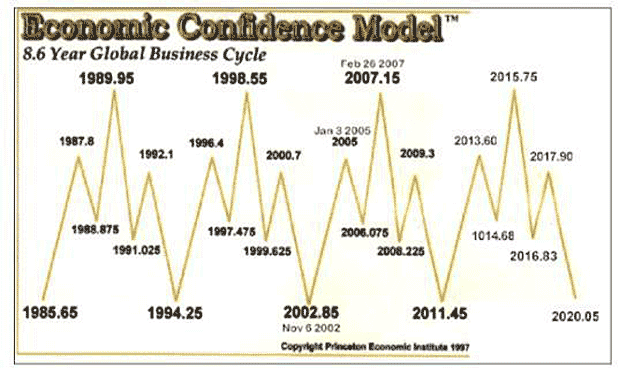
1987.8 was Black Monday. 1989.95 saw the peak in Japan. 1998.55 coincided with the Russian default. 2002.85 came a week or three after the post-dotcom stockmarket low (as did 2009.3).
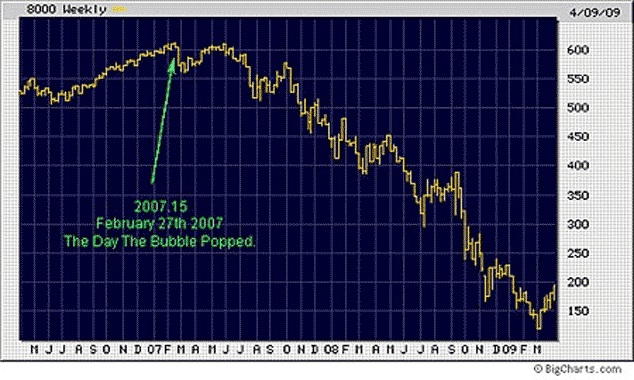
I specifically remember 2007.15 – 27 February 2007 – because I was reading about Armstrong’s work for the first time. That was when this first hissing sound was heard from the great credit bubble. US real estate stocks and financials topped that very day. We all know what happened next. Here’s a chart of the Dow Jones Financials from then.
But I’m getting carried away. It’s too easy, as I’ve said on these pages many times before about so-called cycles experts, to look back at historical events, find some arbitrary pattern and declare it a cycle.
I can look back at all those dates on Armstrong’s 8.6 year cycle, find something that happened on or around that day – or a pattern of events that began around that time – and credit Armstrong with uncanny powers of clairvoyance.
But cycles cynicism aside, I have a soft spot for Armstrong and, as today, 1 October, marks a major turning point in his 8.6 year cycle, I feel bound to mention it.
What happens now
I’ve tried to contact Armstrong numerous times to try and get a clearer idea of what he sees coming – he tends to be a little vague on the blog, saving his big calls for his conferences, DVDs and reports – but he has ignored my solicitations. So I’ll do my best to interpret his blog.
His basic forecast is for “a peak in government”. “Centralised government is dying”, he says. Separatist movements will appear worldwide. “This is the beginning of the trend, which will see the fall of governments and the rise in demands for political change everywhere.”
I would argue that this trend towards secession has been around for a while – Scotland and Greece being the prime examples. I’ve no doubt that Armstrong would retort that, after the elections, the UK and the EU stayed intact. Next time they won’t.
In terms of our investments, “it is not a crash in stockmarkets, commodities or the private sector” we should be worried about, so much as “the bubble in government paper”. Volatility will rise from October, then we “are looking at a panic cycle that appears in the US Fed funds by February, followed by another next August”.
Perhaps, then, the end of the government bond bull market is finally here.
Cor blimey, we’ve waited long enough.
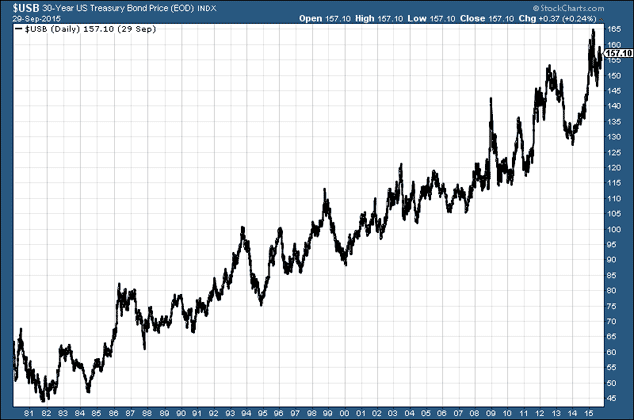
A brief look at the long bond shows that it peaked in April, then fell. With the stockmarket volatility of July and August, it staged a rally, but we’re still a few points off the highs. In fact, I have to say, in the short term, I quite like the look of the chart from a buyer’s point of view. On the other hand, here is the long-term chart, which dates back to the beginning of the bull market in 1982.
You could argue that the trend is your friend – hence that it carries on rising – or just as easily make the case that the thing is too long in the tooth and it’s “time, gentlemen, please”.
Shorter-dated Treasuries, as measured by the Barclays iShares 1-3 Year Treasury Bond index have fared rather better this year and are, pretty much, at all-time highs. Here’s a five-year chart.
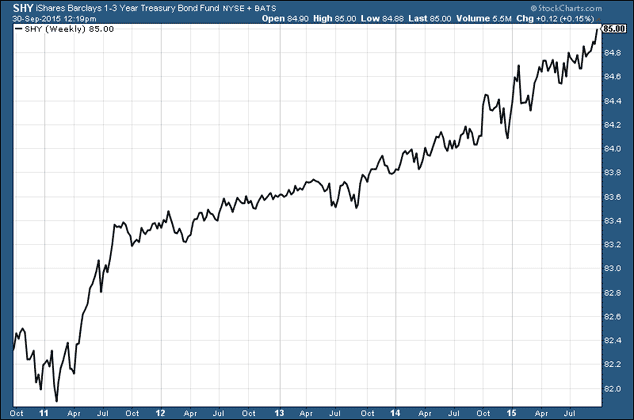
If you’re a short seller, I bet that gets you licking your lips.
There are plenty of other governments whose debt you can short, if you see fit. The US will probably be strongest in the short term.
Armstrong has advised in the past that markets which were trending the strongest going into a cyclical turn point would be the most likely to reverse. In this case, we should also expect to see a rally in both commodities and stocks, but Armstrong is vague on this.
You’d also expect gold to be doubly strong. It’s been weak going into the turn date and it’s, effectively, a short on government. In the longer term, Armstrong seems to be very bullish about gold, but its time has not yet come, he feels.
His main issue is with the bond market – in particular, the sheer scale of it. Yields will rise, even if inflation expectations don’t. Perhaps bonds’ role as a safe haven in times of crisis is over.
It seems that, for now, Armstrong likes cash, specifically the US dollar. And who can blame him? If we really are at the beginning of a crisis in sovereign debt, volatility will be everywhere.
So perhaps he’s a genius. Perhaps he’s another forecaster that needs debunking. Perhaps there’s a bit of both. But given the way that markets are going right now, I’d say that there’s nothing wrong with having more cash to hand than you normally would. I know I do. That said, I opened up a small short in the Barclays iShares 1-3 Year Treasury Bond index yesterday, just in case.
Category: Market updates