15 September 2008.
Lehman Brothers, the fourth largest US investment bank, files for bankruptcy, sending shock waves around the world.
Markets are in a panic. The ensuing rout sees the Dow Jones Industrial Average experience the largest single-day drops in its long history. Twice.
The VIX (a gauge of market volatility, otherwise known as the “Fear Index”) spikes up to 96.4 – double the level it reached in the aftermath of the September 11 terrorist attacks in 2001.
This will be a day long remembered in the annals of market history.
Fast forward six months, to March 2009. The economic fallout of the global financial crisis is continuing to cause chaos around the world. It is clear that no one really knows why this is happening and what will come next.
On 6 March, the market makes a low. So what? The 18-month bear market has seen plenty of lows – and all of them have been broken. This is the important one, though. It’s the low out of which arises the longest bull market in history.
The property market, so entwined with the financial panic, also starts to recover. And in cities around the globe, they get to levels that could scarcely be credited back on that spring day in 2009.
Could we have known in advance that the property market would have imploded so badly at the end of last decade? And could we have predicted, barely six months after Lehman Brothers collapsed, that a recovery would start that would be so swift and so strong?
The answer to both questions is yes. In this essay, and for the rest of this week, I am going to show you how and why.
It’s Akhil Patel here, by the way. We may never have met, but I’m one of the editors here at Southbank Investment Research. I’ve asked Boaz if I could guest edit this week’s Capital & Conflict in order to introduce you to an idea that might well change the way you look at the markets forever…
Once you know this, you will get a roadmap to build wealth for you and your family that could last generations.
Live. Die. Repeat.
In the 2014 Hollywood blockbuster, The Edge of Tomorrow, the main protagonists (Tom Cruise and Emily Blunt) are forever doomed to repeat the same day and over as they wage inter-planetary war against an alien invader.
But each day, despite whatever they attempt to do, and do differently, they are killed before they can manage to get there. And then next day, they are born again and have to try the same thing over and over.
The tagline for the film was: Live. Die. Repeat. Even though each day plays out differently, the result is the same. And it’s an endless cycle of repetition.
Setting aside the sci-fi context, the economy works in exactly the same way. We play out the same story over and over – the story of economic and property boom and collapse – and have done so for centuries.
Each episode ends in financial collapse and recession. And then the next one starts and we repeat the same process – growth, boom, peak and collapse. Over and over and over.
You don’t believe me?
Well take a look at the following graph.
Figure 1. US public land sales, Acres ‘000, 1800-1923
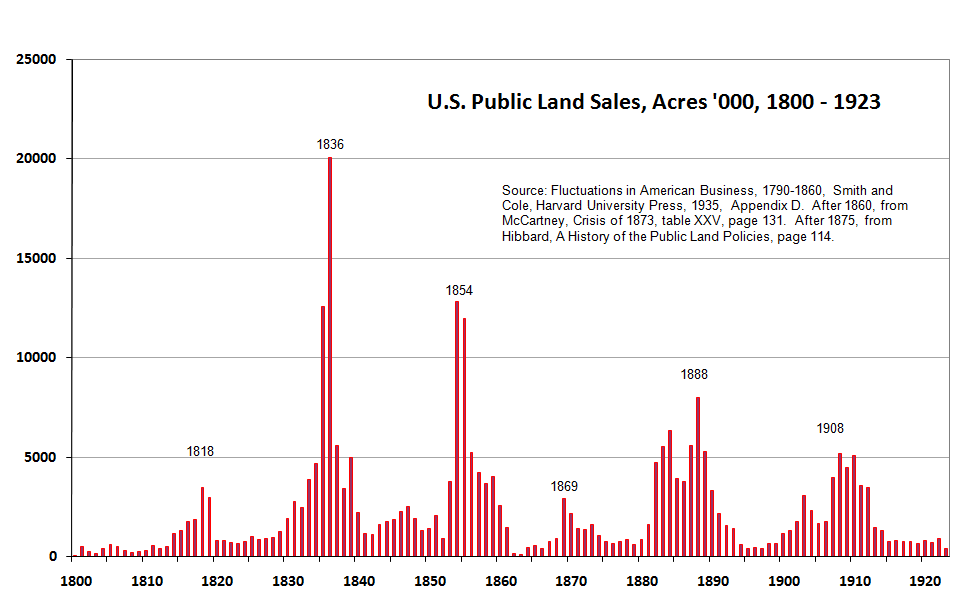 Source: The Secret Life of Real Estate and Banking, Phillip J Anderson
The graphic depicts the sale of public land in the US from May 1800 onwards, when the government made it possible to settle the vast western lands.
Beginning in 1800, land sales proceeded steadily until around 1814 after which there was a massive speculative boom where everyone it seemed was trying to buy land. Eventually, there was a blow-off peak in land sales in 1818, followed by a significant economic downturn.
This took several years, after which the process started all over again.
The land boom of the 1830, into the peak in 1836, 18 years after the prior one, led to the first major depression experienced by the US in 1837. The next peak, in 1854, again 18 years later, was followed by a depression.
The 1869 peak was also followed by depression that lasted most of the 1870s, known as the Long Depression. But eventually things did recover and again, rampant speculation took hold in the 1880s, lead to a peak at the end of the decade, leading to the depression of the early 1890s. By some measures this downturn was more severe than the Great Depression.
But, again, eventually things turned around. The downturn following the 1908 peak was cut short by the build-up to the First World War.
Speculative frenzy reached its highest point, on average (but with very little variation) every 18 years, cycle after cycle, throughout the 19th century, even as the US transitioned from a small agrarian economy to a mighty industrial powerhouse.
This process was assisted, in a manner that is familiar to us by bank credit, which elevated the price of land and the houses built on it. This generated more and more building until there was excess capacity in the market, causing prices to weaken – often sharply, depending on the extent of the building boom.
If you think this is a peculiarly American phenomenon, the cycle has been going on even longer in the UK, every 18 years on average. Each major boom led to a financial panic and economic downturn.
Live. Die. Repeat.
The economic cycle which brought spectacular booms and busts was a repeating 18-year cycle tied closely to speculation in land and real estate.
That was then. But what about now?
It is true that the process of economic growth, leading to wild speculation that eventually turned into a major panic and economic collapse, was interrupted by the world wars. “Normal” economic behaviour was diverted towards the war effort.
But from the 1950s onwards, the same cycle re-asserted itself.
The long boom of the 1960s came to a halt in the early 1970s with a major downturn. At the time it was blamed on the oil shock, but in fact the land boom of the late 1970s was even more responsible. It is just easier to blame foreigners for your troubles.
The turbulence of the 1970s led to the boom of the 1980s. This was heralded as the Age of Greed. In the UK, it was called the “Lawson Boom” after the then Chancellor of the Exchequer, Nigel Lawson. But the result was the same. The major peak in 1990s and recession of the early 1990s.
You can see the rise in real property prices in the graphic below.
Figure 2. Real residential real estate prices for the US (1975 to present) and UK (1968 to present)
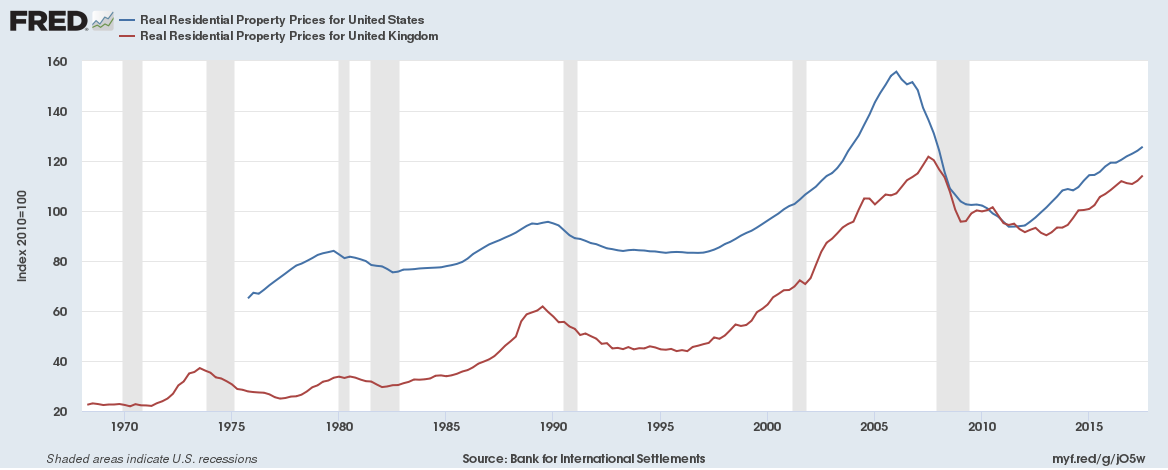 Source: Bank for International Settlements
Each successive collapse catches a new cohort of bankers, investors, policymakers and general population by surprise.
So it was for most of us on that September day back in 2008. And it will do so again in the future.
How each 18-year cycle unfolds
So that’s the big picture.
But a close study of the economic cycles shows how each 18-year segment unfolds.
Within each period of an 18-year cycle, there are regular “internal dynamics” that become apparent if you study each one closely.
In the land market itself, the cycle has so far manifest in a clearly definable 14 years of rising, then four years of declining, prices.
The 14-year expansion can further be divided into two seven-year expansions interrupted by a mid-cycle slowdown.
Historically the mid-cycle does not involve much of a fall in land (real estate) prices and therefore any recession tends to be mild and quickly passed through because bank lending tends to be unaffected – when bank credit remains available to an economy, then the conditions for a swift return to growth are present.
Think about this.
During the last cycle, at the mid-point, we had the dotcom bust. But people talk about that as if it were somehow a “crisis” in the same way as we had during the global financial crisis at the end of it. It was nothing of the sort – and you’d only really know that if you understood the real estate cycle.
The mid-cycle launches the second – and more bullish – half of the cycle, during which consumers spend more freely, government brings forwards measures to stimulate the economy (including large programmes of public infrastructure) and banks credit becomes abundant. This creates a surge in housebuilding and economic activity and a full-scale land boom.
Prior to the peak of the cycle, and particularly during the final 12 to 24 months, you tend to get a period of excessive speculation and quickly appreciating asset prices as well as easily available credit. This period is called the “Winner’s Curse” phase from the fact that the competition for assets (especially real estate) is fierce and that those investors who are able to “win” in this environment will soon “curse” their victory in the ensuing bust just around the corner, because they will find that the assets are worth less than what they paid for them.
The investors who are late to the party in this way are the ones who really feel the negative effects of the cycle.
The end of the cycle collapse is the one to watch out for because the recessions tend to be much deeper and longer than the mid-cycle slowdown and they often involve a major contraction in bank lending, significantly increased unemployment, bank bailouts and a stockmarket crash.
But most important of all from the perspective of an investor in land, the property market corrects on average by 30%. This disguises much greater falls in certain locations as well as a much larger fall in the value of land.
This stylised diagram of the cycle outlines each of the main phases of the cycle.
Figure 3. Stylised diagram of the real estate cycle
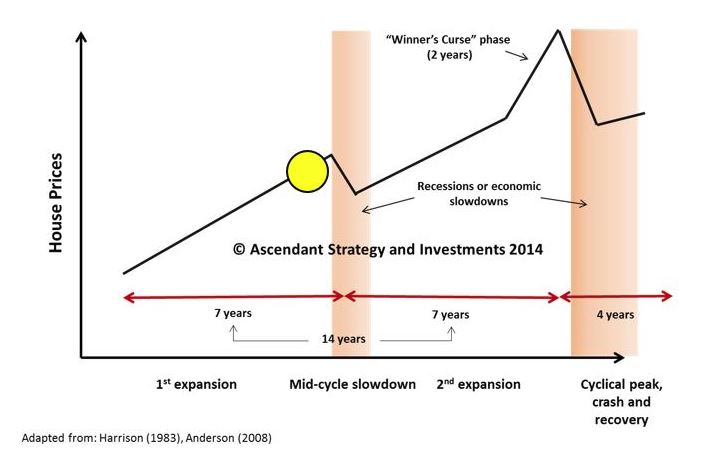 Source: Ascendant Strategy
Where are we now?
If 2006/7 marked the peak in the US for the last cycle, the current cycle began in or around 2010.
Maybe it started a little later in western Europe and other countries such as Australia and Japan – because the historical data shows that the US leads the rest of the world into and out of each cycle.
This was the low point for the US, with the S&P having tanked 50% plus into its low in 2009, and the economy in a major recession and losing almost 100,000 jobs per week.
However, out of that depression the seeds of the next boom are sown. This was why I could be one of the few people in the world calling for a major expansion in early 2009. This was merely history repeating.
The stockmarket tends to lead the economy out of each downturn. In the broader economy we still had problems to resolve into the early part of this decade around 2011.
Seven to eight years on from that we are just about at the middle point of the cycle, which is traditionally where the economy pauses or has a minor recession.
If that happens, you will hear plenty about the “end of days” (a la 2008) but you will now know better, especially if there is a sizeable stockmarket correction.
What will happen after the mid-cycle slowdown?
During the mid-cycle, you can expect the stockmarket to experience a bear market for a year or two. However, the stocks that will be relatively strong, and will lead the way during the second half of the cycle, will be real estate and banking stocks.
To engineer a recovery out of the mid-cycle, central banks will reverse their tightening policies.
Because the mid-cycle does not involve a sharp fall in the price of land it will be more straightforward to get economies out of recession, leading to much self-congratulations among policymakers at their ability to “manage” the economy. Don’t believe the hype.
Expect this to be taking place during 2020/21.
Because we have the framework of the real estate cycle, we know that the mid-cycle will be an excellent time to be in the market snapping up good deals during the slowdown/recession. To prepare for the mid-cycle you need to ensure you have financial firepower available to you to move on opportunities as they arise.
This means you should be building up a cash reserve right now.
After 2021, should history repeat, we should see the start of a booming real estate market. The strong years of the 2010s will be nothing like the boom to come.
The land boom and speculative frenzy starting in 2023/24
By 2024, we’ll have hit the Winner’s Curse phase, the final two years prior to the peak. This is when early investors should be ready to get out of the market rather than chasing deals at ever inflated prices.
It’s certainly not the time to load up on debt (even though this will be in plentiful supply).
The characteristic of this part of the cycle is that speculation plays as much of a role in this boom as does business expansion, though standard economic data may not be able to distinguish between the two.
People have money and they want to spend it. And invest it in assets that they see as only growing in value. In this phase of the cycle, higher demand for real estate (land) is more obvious; and land is more expensive to acquire, mortgages comprise an increasing proportion of the loans made by the banking system. And so the quality of a bank’s loan book is increasingly predicated on high real estate prices.
A characteristic of this phase is easy credit and relaxed lending standards. The regulations put in place after the last crisis to “prevent” the next one will have been fully undone by this point (this is something that the current US administration has started to do).
In response to a booming economy and runaway asset prices, the Federal Reserve and other central banks will begin another tightening cycle. The yield curve will start to flatten and credit spreads will become tight. These are warning signs.
And at this time the news will be about the “world’s tallest building” which will soon start to be built.
The world’s tallest building marks the peak of the cycle
Amid the land boom of the 2020s, one of the best signals of an imminent cycle peak will be the announcement of a major scheme to build humanity’s tallest/longest/deepest/grandest structure. An architectural and engineering marvel, you will be told.
The skyscraper is the simplest and most reliable indicator of a financial crisis and severe recession.
The economics of such buildings require: i) ego; ii) high land prices; iii) lots of (cheap) credit. You have to have a big ego to conceive of such a project; like the Tower of Babel, these are, more often than not, monuments to man’s hubris rather an exemplar of the efficient use of scarce capital.
The business case of such projects, however, rest on land being expensive, such that building up generates the necessary rental income to justify the cost of land. The higher the land price the taller the building.
And finally, you need a backer with deep pockets. When credit is loose then you will be able to find a bank or consortium of banks willing to lend you the money.
Prior cyclical peaks have been marked by such buildings – such as the Burj Khalifa in Dubai (2010), One Canada Square in London (1991), the Sears Tower in Chicago (1974), or, perhaps most famously, the Empire State Building in New York in 1931.
Given construction timescales, such buildings invariably open during the subsequent economic depression and their owners struggle to find tenants and so remain partially vacant for several years.
I use a basket of indicators to track each phase of the 18-year cycle for my Cycles, Trends and Forecasts readers but the main phases are easy enough to spot if you know what you’re looking for.
It’s important to do this because it is difficult to get caught up in the euphoria and emotion of the boom years. The coming boom will be the biggest of all time, with more wealth created in the next decade than in human history to this point.
This is quite a claim to make. But I can back it up and will go into this later this week.
Furthermore, by the time we reach 2026, the forecast date for the next cyclical peak, no one in the world under the age of 40 will have much professional memory of the 2008 crash. So it would be no surprise to hear a newly minted 30-something billionaire declare that real estate prices will never go down.
When you hear that, you’ll know what is about to happen.
Thank you for reading this piece. But this is just the start. Tomorrow, I will tackle why the cycle repeats – and why no one can see it. This is despite the fact that the historical evidence is so clear.
Stay tuned – I’ll be in touch again tomorrow with more.
Best,

Akhil Patel
Guest editor, Capital & Conflict
PS If you’d like to know more about my work, and you’re not prepared to wait until tomorrow, I’ve arranged for a little bonus for all Capital & Conflict readers.
Last year, I gave a talk to hundreds of Southbank Investment Research customers at The War on You conference, called “The big con: how the elites corrupted economics”.
The conference was a ticketed event with only paying customers, but as a thank you from me for reading today’s Capital & Conflict, you can watch the whole talk here.
Category: Market updates