‘As goes January, so goes the year’, runs the stock market maxim.
There are still three days to go, but the omens are not good.
The Dow is down almost 4%. The S&P 500 is down about 3.5%. And the FTSE 100 is down about 3%.
Such quirky maxims are easy to dismiss. But – for reasons I cannot begin to explain – the January barometer works amazingly well with the S&P 500.
So has the time finally come to sell the US stock market?
A surprisingly reliable seasonal indicator
The New York investor Yale Hirsch, founder of the Stock Trader’s Almanac, brought us the idea of the ‘January barometer’ back in 1972. The thinking is, quite simply, that a good January portends a good year, while a bad month means you can expect a bad year.
Like that other seasonal maxim, ‘Sell in May and go away’, it works surprisingly well. The Stock Trader’s Almanac claims the indicator has an 89% success rate. (What we’d really like to know, of course, is how to tell when it’s one of the 11% of times it isn’t working.)
Meanwhile, Sean Hanlon of Hanlon Investment tells us that for US stocks: “For the 64 years from 1950 through 2013, a positive return in January was predictive of a positive return for the year 92.5% of the time”.
It doesn’t work so well on the downside. A negative return in January is predictive of a negative year just 54% of the time. You may as well toss a coin. But while a down January need not mean a down year, there’s still plenty to infer.
According to the Stock Trader’s Almanac, since 1950, every single time that January produced a negative return for the S&P 500, it either preceded or continued a bear market, or a 10% correction, or a flat market. In other words, if January ends at these levels, there is very little to be bullish about.
“Twelve bear markets began, and ten continued into second years with poor Januarys”, points out JC Parets of AllStarCharts. “When the first month of the year has been down, the rest of the year followed with an average loss of 13.9%.”
So given the apparent effectiveness of the January barometer, I shall be watching closely to see where markets close on 31 January.
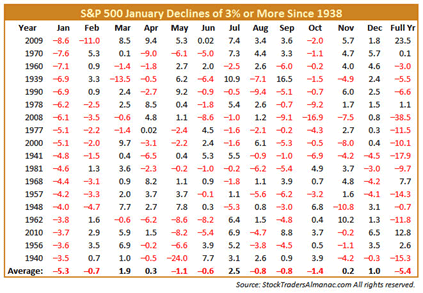
For those of you interested in the hard numbers, the Stock Trader’s Almanac has produced this table showing what followed negative Januarys. It’s worth perusing.
Is this a good omen for gold miners?
Another reading to take from the January barometer is that of sector strength. The top-performing industries in January – and the weakest for that matter – tend to out- and under-perform for the remainder of the year.
If you like your mythology, you’ll know Janus is the Roman god of, among other things, transitions. Perhaps we’re seeing a transition – there is one notable outperformer this year so far.
One of the reasons the FTSE has been stronger than the American indices this past month is that it is more heavily geared towards mining. Mining stocks have been strong.
Of course, this could just be a simple bounce off oversold levels, while the weak US equity markets could just be catching their breath. But the alternative is that we’re seeing a reversal and the start of a new trend that might last throughout the year and beyond.
After a dismal two years, are mining stocks – and, in particular, gold stocks – embarking on a new run? And are the broader stock markets, after a stellar two years, set for a period of stagnation? Maybe.
The film Trading Places was based (loosely) on a true story – that of the ‘Prince of the Pits’, commodities trader Richard Dennis. Dennis believed he could train traders as fast as turtles were raised in farms. Together with William Eckhardt, he found 20 novices who knew barely anything about trading or investing, and trained them in a simple trend-following system he had devised – hence the expression ‘turtle traders’ was born. Five years later the experiment ended and the turtles had reportedly made $175m between them!
As Mark Mahaffey of Hinde Capital notes, the trend-following indicator that the turtles followed – a break of the 20- and 55-day trading ranges – has just flashed. In other words, the price of the S&P 500 has fallen below these levels, while gold and godl stocks have broken above. Such a break may mean nothing, but given that it has come at the end of such a prolonged run, it is worth noting.
What’s more, the dramatic falls we have seen in emerging-market currencies over the past week will, if they continue, mean significantly lower input costs for miners operating there (of which there are many). It will also mean greater profits for those selling into international markets for US dollars.
Rising metal prices would further help miners, of course. Given that gold tends to thrive during currency turmoil, we may get some more upside to gold.
Factor in both the high valuations on US stocks and the January barometer I’ve outlined above and you start to think: “Hang on a minute – this could be a reversal taking place here”.
It’s too early to say for sure, of course. I think there’s a chance the S&P 500 could rally to around 1,810 before dropping down towards the 1,710 area. And if you do decide to play the ‘long-gold-miners’ or ‘short-the-broader-indices’ trend that may or may not be developing, use rigid stop losses – in case the trend isn’t your friend after all. Either way, we should see further evidence in the days and weeks ahead – and I’ll keep you updated.
• Life After The State by Dominic Frisby is available at Amazon. An audiobook version is available here.
• Follow @dominicfrisby on Twitter.
Category: Market updates