Today we turn our attention to group ten of the periodic table, d-block.
If ever there was a more gripping opening line to a Money Morning, I’d like to know what it was.
I’m talking, of course, about the chemical element with atomic number 78.
It gets worse, doesn’t it?
Platinum is the sujet du jour. I bought some yesterday. I think it’s going to go up. Here’s why.
“Little silver” looks as though it’s about to reverse direction
Here’s a little discovery I made yesterday. Although platinum is today mostly produced in South Africa and Russia, it first found use in pre-Columbian South America.
Hence the name “platinum” – it derives from the Spanish platina, which means, “little silver”. Don’t you just love Wikipedia?!
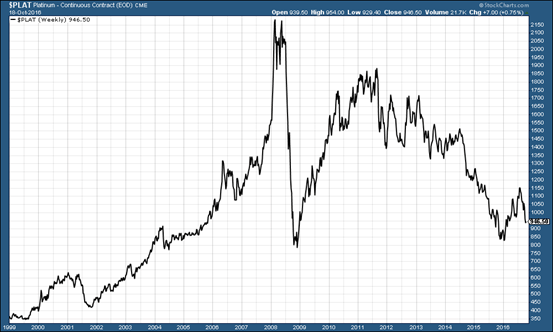
Platinum was a darling of the pre-2008 commodities boom. Starting at a low of $350 an ounce in 1999, it went up, up and away, reaching a high just shy of $2,300 an ounce in 2008.
Then it crashed hard and lost two thirds of its value. $750 was the 2008 crash low. We got a multi-year rally to $1,950, but since 2011 it has ground lower.
It hit a low of near $800 earlier this year. It enjoyed a nice bounce to $1,200 in August, since when it has sold off quite violently to $930 earlier this month.
Here’s a long-term chart for your perusal.
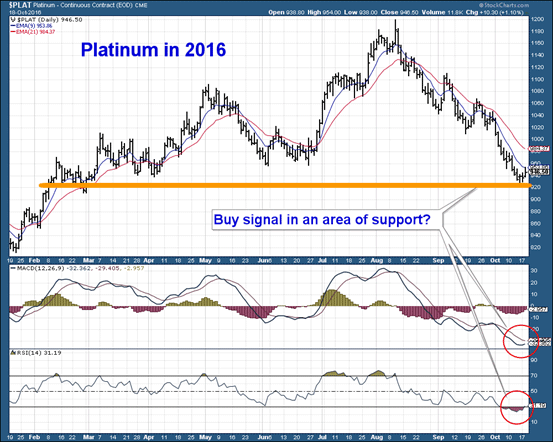
So why am I bringing it up now? Well, I was just flicking through some charts yesterday and this one caught my eye.
First, $930-940 is an area where platinum has found some support in the past. Second, the selling momentum seems to be running out of steam. If you look at Relative Strength (RSI), circled at the bottom of the chart below, you can see we have gone off the bottom of the scale. Third, we are about to get a “MACD (Moving average convergence divergence) crossover”, also circled.
These are all tools that some momentum traders would use to signify a change in trend. So the signs suggest that we are getting a reversal at a point where platinum has enjoyed support in the past.
Platinum’s fundamentals look amazing – but what’s new?
With the technical having piqued my interest, I started digging around at the fundamentals.
Every time I look at the fundamentals for platinum – global supply versus global consumption – I think, “this can’t last”. And so it is again. The go-to research on platinum comes from metals specialist Johnson Matthey. Let’s look first at supply.
From 2004 to 2007, global supply came in north of 6.5 million ounces a year. That figure slid to around the six million ounces mark over the next three years. Since 2012, the supply levels have slid below six million ounces – as low as 5.1 million ounces in 2014. Supply is estimated this year at 5.9 million ounces.
Platinum demand breaks down as follows: about 40% autocatalyst; 35% jewellery; 23% industrial, and 2-3% investment. It has been north of 7.9 million ounces every year since 2005, with the exception of 2009. In 2016, it is estimated at 8.7 million ounces.
There’s quite a big gap between supply and demand – almost three million ounces, or one third of global supply. Surely that gets you salivating. It does me. But it happens every time I look at platinum supply-demand numbers, so I’ve learnt not to get too excited.
The difference between supply and demand is usually made up by recycling – about two million ounces or just under – and selling off existing stockpiles. Recycling is fairly constant – like mine production and demand. The stockpiles are the main variable, and it’s the above-ground supply that seems to determine the price.
About 650,000 ounces have been de-stocked from South African miners’ inventories over the past two years. But Johnson Matthey takes the view that the destocking cannot continue at current rates.
“On the basis that producer stock levels are now at their lowest level for many years, it is unlikely that supplies can be supplemented by significant stock withdrawals for a third consecutive year.”
Moving forward, here are some of the other factors to consider.
There has been no recent mining boom in platinum – no new elephant discoveries and no investments of a scale sufficient to rapidly boost global production.
European autocatalyst demand is constant and increasing, according to Johnson Matthey. The same goes for Chinese jewellery demand. And there seems to be increasing interest from Japanese investors. Don’t know why (negative interest rates maybe?), but they bought 700,000 ounces last year, more than offsetting investor selling in the West and keeping the market in deficit.
I seem to go through this process every year. I look at Johnson Matthey’s research and conclude the supply-demand deficit cannot continue, yet somehow it always does. So when I make the case that the current supply-demand deficit cannot continue, I do so with a heavy dose of cynicism.
However, I like the fact that the fundamentals and the technical are both lined up nicely. That’s what persuaded me to buy some platinum yesterday.
How to buy platinum
How do you invest? As always with metals, there are various options. One is to buy the platinum producers. (Don’t type “platinum producers” into Google, by the way, you’ll get a list of record companies.)
Anglo American Platinum (LSE: AAL) is the biggest; Lonmin (LSE: LMI), Jubilee (LSE: JLP) and Sylvania (LSE: SLP) are others to consider. If I had to pick one, I’d say Sylvania, but I don’t own any in my portfolio. You could even go Johnson Matthey (LSE: JMAT) and play the refining end of the game.
You can buy physical metal itself, or the one of the platinum ETFs (LSE: PHPT or LSE: PLTM), though these are listed in dollars, so there is the weak pound to consider.
My preferred method in this case is via a spread bet. It’s the cheapest, simplest way of buying pure platinum-versus-US-dollar exposure, though of course there are all the associated risks of spread betting. Don’t play that game unless you know what you are doing. It’s always important to manage risk and use stops – I’ve put mine just north of $900 – just below the February lows.
Fingers crossed it works out.
Category: Market updates


