I must have got through 50 charts yesterday afternoon looking for trading opportunities.
I was about to throw in the towel and take the dog out, when, finally, a chart caught my eye.
That chart was copper.
George Osborne’s been boasting about the economy – but what does ‘the metal with a PhD in economics’ have to say about things?
He’s looking a bit jittery, I have to say.
Is ‘Dr Copper’ really a good nickname?
Some see copper as a leading economic indicator. Where copper goes, the economy follows. Hence the name ‘Dr Copper’ – the metal with a PhD in economics.
It has this reputation because copper is used in just about every sector of the economy – from building to manufacturing to power transmission. So if an economy is growing, there’s going to be more demand for copper. And that should push prices higher.
But, of course, it isn’t quite that simple.
Copper isn’t widely used in high finance, so Dr Copper’s relevance might be a little out-dated, at least as far as the UK is concerned.
And like any metal, copper is also rather susceptible to supply gluts and shortages, which will affect its price no matter what the broader economy is doing.
One such supply glut has been the probable cause of copper’s fall in price this year. While metals generally have done OK, copper was at one stage down around 20%, from $3.42 a pound to $2.87. In March alone it fell by 10%.
Data from metals researcher CRU suggests that the global surplus of copper may reach 140,000 tons in 2014 – four times larger than previously estimated.
Why the glut? Because demand from copper’s largest consumer, China, is falling. This falling-demand-from-China story put the fear of God into the copper markets – hence the declines.
So how can we profit from this?
Copper is at a key turning point – so here’s a low-risk trade
London Metals Exchange warehouse data, and projected warehouse data, is a dark and shady place where your author fears to tread. Data from China’s manufacturing sector, released over the past couple of days (and similarly shady, perhaps) has been mixed – neither decidedly bullish nor bearish.
So on the fundamental side, there are no obvious clues as to copper’s future direction. Instead, it’s the price action that has caught my attention.
Since hitting a high of $4.65 a pound in early 2011, the copper price has been trending steadily lower. It’s now in a three-year trend. There have been collapses and strong rallies over that time – but the broader direction has been down. However, every time the price has gone to $3, it has found support.
Until last month, when $3 gave way.
Below, you can see the chart of copper since 2011. I have defined the downtrend with that blue diagonal line. The beige shaded area is the zone of support at around $3. The red, orange and green lines are simple moving averages – one-year, 55-day and 21-day. They are all sloping down. This is what a downtrend looks like.
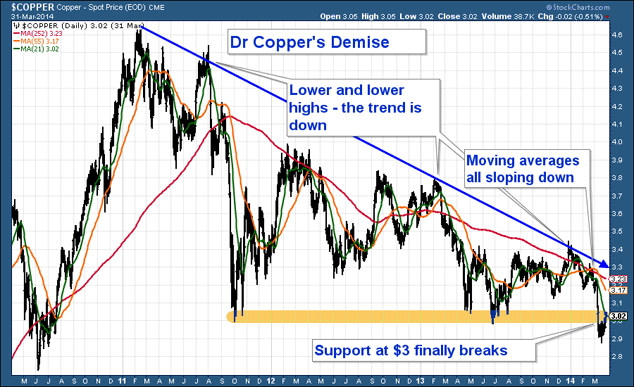
The reason I’m excited about copper is the fact that the $3 mark finally gave way last week. What was support may now become resistance. That means we have a set-up for a low-risk trade.
Normally, I would simply say short copper. If it rises above the amber band, I’m wrong – so have a stop there and take a loss. But I can see so much resistance at $3.20 or just below that I’d be tempted to go short there as well.
Perhaps a way around it is to have a much looser stop-loss above that falling blue diagonal line. As long as copper is below that, we want to be short.
How low can copper go?
Let’s take a look now at a chart of copper since 2001 – when its bull market began. This will show you just how low this thing can go.
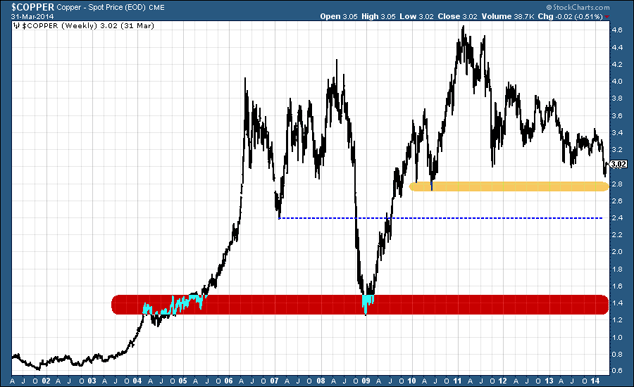
The next big line of support is at $2.80, where I have drawn an amber band. Below that we have the dotted line at $2.40.
Below that… ouch. We could be going all the way back to the 2008 crash lows, where I have drawn that red band. There’s barely any support on the chart.
I don’t think a trip to the red band is likely. But technically, it looks like a distinct possibility if $2.80 doesn’t hold.
Remember – there is no plunge protection team looking after copper. The Bank of England didn’t buy copper with its quantitatively-eased money. It bought gilts. Its 0.5% interest rates are there to prop up the housing market, not London Metals Exchange inventories. This is a ruthless, unforgiving market.
If copper does go that low, the proverbial really will have hit the fan in China. What would the implications of that be for an intertwined global economy? From London new-builds to US government bonds, you might see quite a bit of selling from Chinese scrambling for cash.
Maybe I wasn’t giving Dr Copper enough credit. Perhaps he does have a PhD after all. We’ll see.
• Dominic Frisby is crowd-funding his latest book, Bitcoin – the Future of Money. His first book, Life After The State, is available at Amazon. An audiobook version is available here.
• Follow @dominicfrisby on Twitter.
Category: Market updates