I want to take a look at currencies in today’s Money Morning.
The foreign exchange markets have hogged headlines in recent weeks. The turmoil in the eurozone has sent the euro sharply lower against the dollar, while the Swiss government’s decision to keep the Swiss franc from strengthening against the single currency also shocked investors.
But amid all the turmoil, sterling has kept a relatively low profile.
So today I’m going to consider some charts of the pound, the euro and the US dollar and see if I can divine where our once glorious British pound is headed next.
What drives the pound?
We start with a long-term chart of the pound against the US dollar. I’ve posted a similar chart before, but I always enjoy looking at the strength of the pound and comparing it to the strength and popularity of our leaders.
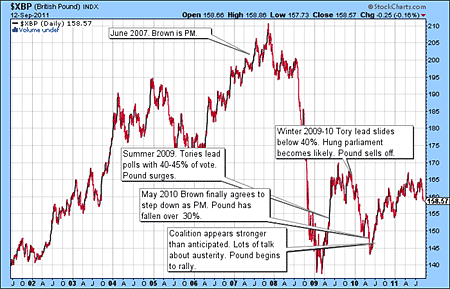
(Click on the chart for a larger version)
Despite wobbles in 2005, the pound liked Tony Blair. After the dotcom crash, it rose from a low of around $1.40 to a high over $2.00. And we all know you should always sell the pound at $2.
It had a rather different view of Gordon Brown, however. In barely six months, it gave back all the gains it had made over the previous eight years. It then rallied as the Tories surged ahead in the polls in summer 2009.
It fell again the following winter when the polls showed a hung parliament was likely, and then, in the weeks after the general election as the coalition government made a show of unity, it rallied. But whenever they start squabbling, as in autumn last year and now, the pound tends to sell-off.
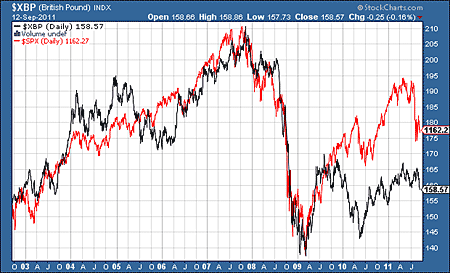
Of course, there are other factors that determine pound strength versus the dollar. Chief among them is what is going on across the pond. But I think this next chart is most interesting. The pound is in black and the S&P 500, which I use as a proxy for global stock markets, is in red. With the exception of early 2010, when forex markets were worried about a hung parliament in the UK, it is very much whither the stock market, thither the pound. When stocks go up, so does the pound, and vice versa.
(Click on the chart for a larger version)
It’s no surprise that we rise and fall with the stock market. Our economy is totally reliant on the financial services sector.
Buy the pound at $1.40, sell it at $2
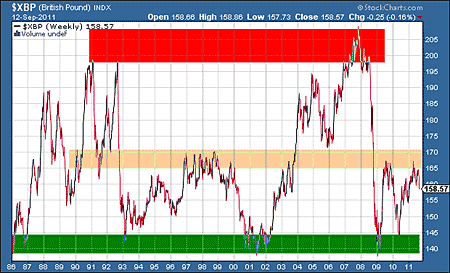
Of course, I could spend many hours arguing what the drivers of the pound really are, whether politicians have any effect at all, and so on. One of the reasons I like charts is that they allow you to cut straight to the chase. If we look at a very long-term chart of the pound, since 1986, we can see that, quite simply, you sell the pound around $1.95-$2.05 (in the red zone), you buy it in the $1.40-$1.45 range (marked in green) and there is resistance on the $1.65-$1.70 range (amber). It’s pretty darn regular.
(Click on the chart for a larger version)
There are all sorts of reasons we can find for the recent sell-off in the pound, but put simply, it hit the amber resistance zone and stalled, just as it did throughout the 1990s.
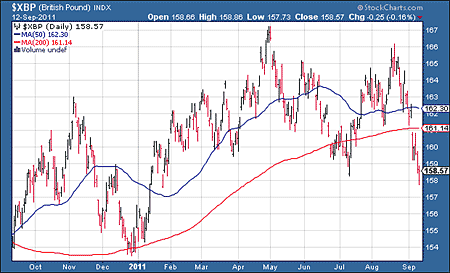
So what about now? In the short-term, I am negative. After hitting that amber wall of resistance in May, it made a second attempt to get through in August but it was a lower high. It has now broken down below the July lows. In other words we are making lower lows and lower highs.
We have broken below the one-year moving average, while the 50-day moving average (blue line) looks like it’s about to turn down through the 200 day moving average (red line) and give us a fabled ‘death cross’, which would be an intermediate term sell signal.
(Click on the chart for a larger version)
We may rally back to the $1.60 area in the short term, but I expect we’ll see $1.54 within the next month or two. There should be some support there. But given the state of stock markets, and how they rise and fall in tandem with the pound, not to mention the state of the coalition government, it really wouldn’t surprise me to see $1.50 before Christmas.
The pound should climb against the euro
Against the euro, however, I am considerably more bullish on the pound. First, below is a long-term chart to consider. It shows the pound vs the euro since 1991. You can see how cheap the pound now is in historical terms.
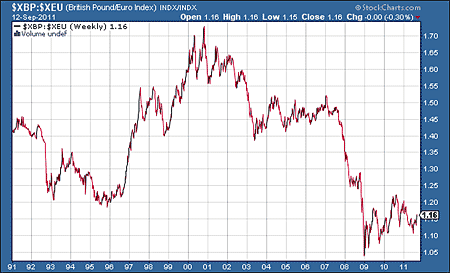
(Click on the chart for a larger version)
We have been in a nice uptrend since hitting near parity in early 2009, and we are now sitting in the lower end of that range.
Zooming into a one-year chart (see below), you can see that nice uptrend since July. It is now sitting above the 200 and 50-day moving averages and the 50 (blue line) looks like it’s about to turn up through the 200 (red line), which it will if the pound can stay above €1.15.
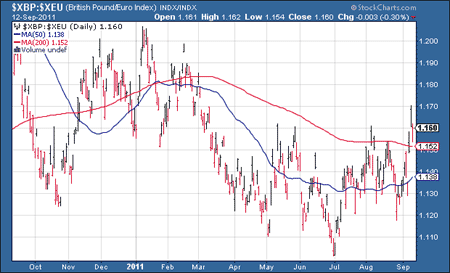
(Click on the chart for a larger version)
So, provided the pound can stay above €1.15, I think we’ll see €1.20 and even €1.25 before you know it. It’s no surprise, given the rotten state the continent is in. But it’ll be a while yet before those trips to the Med look cheap again. Assuming there’s no southern European default, of course.
Category: Market updates