Everything’s looking decidedly dodgy at the moment.
I don’t think I’m alone in thinking this.
Some markets look worse than others. But wherever I seem to look, I’m wincing and thinking, “Ooh, that could end badly”.
Is this just me being paranoid? Or is my sixth sense justified?
Exhibit A – the stock market
In early September, the FTSE 100 broke above 6,900 to new highs. ‘From false moves come fast moves’ as the old trading adage goes – barely a month later and it hits 18-month lows of 6,300.
Germany’s Dax, which peaked above 10,000 in July, touched 8,700 last week. These were also new lows for the year. The major indices of France, Germany and the UK are all lower than where they began 2014.
So we look at the global stock market superstars across the pond in the US (where there has been the most quantitative easing, compared to anywhere in Europe at least).
US markets are considerably stronger. The S&P 500 peaked at 2,019 a month ago. Last week it touched 1,874. The Dow has made similar falls from 17,350 to 16,310. But neither is at the lows for this year – these came in early February – although the Dow is trading marginally lower than where it began 2014.
What is concerning for American equity investors is that the Russell 2000 small-cap index did hit its 2014 lows a few days back. And, at 1,062, it is below the 1,160 level where it began 2014.
The received wisdom is that small-caps tend to lead, in which case – unless we see a rally fairly soon – things do not auger so well for the S&P and the Dow.
Exhibit B – commodities
Crude oil has fallen sharply. Brent was almost $116 a barrel in June, now it’s $85 (matching the lows of 2012). West Texas was $107 – now it’s $82 (at two-year lows). Both fell by around $4 just yesterday. These drops have come at a time of severe geopolitical tension in the Middle East – the sort of tension you might have expected to push prices higher.
Many think that a low oil price is good for the economy because it means lower input costs for many businesses. This is something I agree with in principle. But in this context, the falling oil price may bode ill for markets. A high price means that people feel confident enough to drive up speculative assets with borrowed money – a plunge like this suggests that confidence is vanishing rapidly.
Iron ore is also mired in a downtrend – it saw new lows in the last month, of $80 a tonne. We are a long way from the heady days of $180 a tonne back in 2011. At $3 a pound, copper is also sitting on key support. The $2.80-$3 area has been the last line for copper since its $4.65 peak in 2011. Though it did rebound a few pennies yesterday.
This all points to a slowdown in Asia – in China, particularly.
Precious metals too – whether gold, silver, platinum or palladium – have all fallen hard and, like copper, are sitting on multi-year support.
This multi-year support issue also applies to the major producers such as BHP Billiton and Rio Tinto. BHP, as the world’s largest commodity producer, can be seen as a bellwether for the sector. In the chart below, you can see the range that BHP has been in for the last three years – and how many times in recent years it has flirted with the 1,600p area or just above?
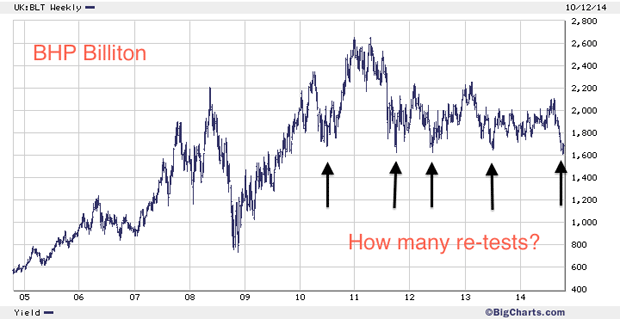
I’m forever saying the more something tests a level the less likely it is to hold. It may be, of course, that we get a false break below before a rally higher. But if I was long BHP, I would have a stop in the high 1,500s in case that level doesn’t hold. If it doesn’t, then 1,600 is quite a level to break.
Elsewhere in the commodity sector, the grains, cotton and sugar have all been weak – particularly the grains.
Exhibits C, D and E – currencies, deflation, and London property
Then we have the huge recent volatility in the currency markets – exhibit C – with the dollar rising; the pound, in particular, looking very weak at $1.59 (a 13-month low); and the euro with its own numerous problems.
Exhibit D sees inflation (as the government measures it at least) falling to a four-year low in the UK. Of particular note is the yield on a 50-year gilt falling to its lowest level on record – below even where it was in the aftermath of 2008. We really are turning Japanese, it seems. Even lower rates could lie ahead – indeed, this is already being reflected in the mortgage market with the Nationwide slashing its mortgage rates last week.
Finally, we have Exhibit E, London property. There seems to have been a marked slowdown there too. There’s more property on the market, falling asking prices, the housing-related stocks (builders and the estate agents) all in downtrends, and estate agents reporting lower sales. A slowdown in London property prices was almost inevitable, but this one ‘feels’ like something bigger is afoot.
What’s the significance of London property? It’s another area that has received too much speculative, geared capital; it’s symptomatic of speculative booms, and it’s another area where the bubble seems to be deflating.
There are plenty of other exhibits on offer (why not suggest yours in the comments section?) but what it boils down to is that markets that were previously shrugging off bad news are no longer doing so.
So is it time to pile in on the short side? Despite my misgivings, I’m not so sure, for the simple reason that my inbox has been flooded with predictions of some kind of crash ahead. The perma-bears are making too much noise. It depends on how you define crash, of course. But epic, 2008-style crashes are rare – I’d say once in a generation, except that we’ve had two since 2000 – but still so rare, that their improbability makes betting on one a widow maker. From a sentiment point of view, everyone seems to be too ready to call a crash for this to really be the big one.
So the way I’ve been playing it is, simply, to build up cash – in US dollars where possible.
I think we’re going to get a bounce from here. But – if we do – I’d use the opportunity to raise some cash if you’re heavily geared to any of the markets I’ve described above. It might be that some real opportunities lie ahead on the long side, particularly in oil and copper – I just don’t think we’re quite there yet.
Oh and just to mention – the physical copies of Bitcoin: the Future of Money? arrived last week. Finally. They look great. I’ve signed those that needed signing and I’m assured they are being sent out tomorrow. (I don’t entirely understand why they weren’t sent out last week). Order your copy here.
Category: Market updates