It’s going to be a miserable ten years for US stocks. That’s what Michael Lebowitz CFA claims on realinvestmentadvice.com. And he’s got plenty of data and analysis to back him up.
Of course, the world’s stockmarkets take their lead from the US. So let’s look into what Michael is thinking. And how his analysis works.
The idea is that you can value a company. And then compare that value to the current price. If it’s expensive compared to history, then your returns will be low. If it’s cheap, you’ll make lots of money.
But expensive and cheap are confusing terms in the stockmarket. Everything is relative. And in the case of stocks, it’s relative to the profits the company is making.
If profits are high relative to the price you’re paying for the stock, it’s cheap. If the price is high relative to the profit, it’s expensive.
We use the price/earnings (P/E) ratio to measure this. At £10 profit and a stock price of £100, you have a P/E ratio of 10. At £5 profit and a stock price of £100 you have a P/E ratio of 20. 10 is cheap, 20 is expensive.
The US stockmarket is currently trading at a P/E ratio of over 30, depending on how you define profits. That effectively means stocks are earning £3.33 profit for a stock price of £100.
The right question to ask, according to Lebowitz, is whether this makes stocks expensive or cheap compared to history.
Here’s his answer:
 Source: realinvestmentadvice.com using data from Robert Schiller
I know that doesn’t help. Here’s what it shows and what it means.
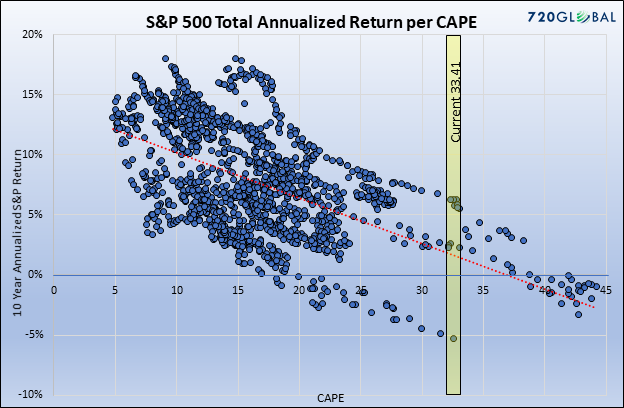
Each dot on that chart represents a month since 1871. It shows the CAPE, which is a version of the P/E ratio, at which US stocks were that month. And the percentage return you got over the next ten years if you invested in stocks at that time.
The downward sloping red line tells you that months with more expensive stockmarkets, to the right-hand side, led to lower returns over the subsequent ten years. Cheap months with low P/Es gave you higher returns. Makes sense.
We’re currently in the yellow box, with a P/E above 30. That’s very expensive. In fact, stocks were only more expensive during the tech bubble of the 1990s.
The return on stocks over the subsequent ten years when they were this expensive has ranged between 7% and -5% since 1871. It’s an annualised amount, so the number is an average return each year. The conclusion suggests stocks won’t go up much over the next ten years.
In other words, given how expensive stocks are at the moment, you can’t expect to make much money over the next ten years.
But it’s not that simple.
The better alternative to stocks
Investors always have a choice between different asset classes. The key choice is between stocks and bonds. If you apply this choice to the idea above, you get a more useful conclusion.
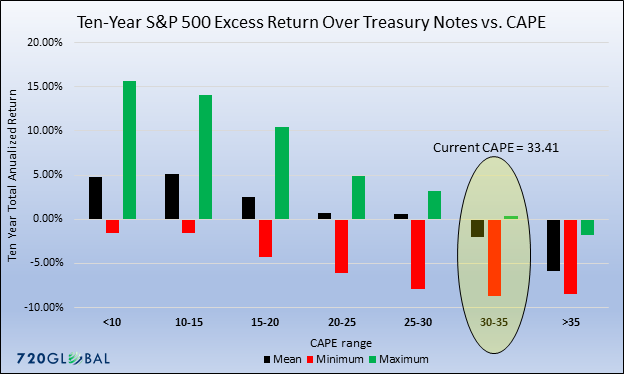
The next chart uses the same information above. But it adds in a new factor. It compares the ten-year return of the stockmarket to the interest rate you’d have received on a ten-year US government bond.
The idea is the US government bonds are risk free. If stocks are going nowhere fast for ten years, and US government bonds are offering a 5% return, you should buy the bonds instead. The certainty they provide is preferable.
And that’s just what this chart suggests. The yellow circle highlights where we are in terms of the P/E ratio. The black bar shows that, when P/E ratios were this high, the subsequent ten-year return in US government bonds was better than in the US stockmarket on average. About 2% better.
 Source: realinvestmentadvice.com using data from Robert Schiller
The red and green bars show the worst and best performance of the stockmarket beyond the US government bond return.
Odds are, you’re much better off in US government bonds over the next ten years.
What this analysis is missing is obvious.
A lot can happen in ten years
During the next ten years, stocks are likely to become even more expensive at some point. And vastly cheaper during a crash.
No doubt Lebowitz is fully aware of this. So his conclusion isn’t to sit in bonds and go into hibernation for ten years.
The idea of his analysis is to warn you away from buying now. Wait until the P/E ratio falls, telling you stocks are cheap. Keep your powder dry.
And bonds are a good place to do just that. Especially given their return is higher than the expected return on stocks over the next ten years. But mostly because bond values tend to rise during a crash. So they’ll rise in value just when you should consider selling them and piling back into the stockmarket.
And the time will likely come well within ten years to make the move back into stocks.
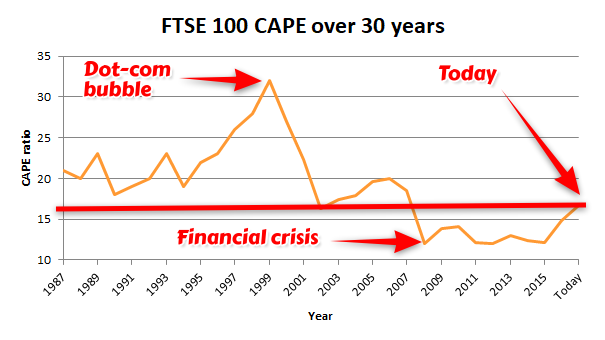
The FTSE isn’t expensive
What about the local stockmarket? Well, our local P/E ratio is around the long-term average according to Stockopedia. It’s fairly valued, as they say.
 Source: Stockopedia.com
Does this make UK stocks a buy? It certainly does relative to US stocks.
But don’t forget the power of the US stockmarket to cause trouble for everyone else.
Until next time,
Nick Hubble
Capital & Conflict
Category: Economics