Before we get going, just a reminder that right now, there’s a way you can claim a free copy of Charlie Morris’s complete strategy for surviving the market downturn, “Surviving the Next Bear Market: a field guide for investors”.
As the man who steered $3bn in client capital through the 2008 financial crisis, Charlie is the man I’d want on my side heading into 2019.
You can grab a copy of his guide here.
Now, on with the issue…
Further to yesterday’s letter, today we continue “The future, in pictures” – an issue of The Price Report, Tim Price’s investment advisory. If you want to preserve and build long-term wealth, Tim’s a man worth listening to – and this is one of the reasons why.
Enjoy!
The future, in pictures: part II
Tim Price – 24 May 2018
Which charts would I use to underline my own investment thesis for the years to come?
The first one is an easy choice, and a regular The Price Report fixture. It shows OECD forecasts of the size of middle-class populations, by region, around the world.
Growth of the middle-class population, as forecast by the OECD, by 2030
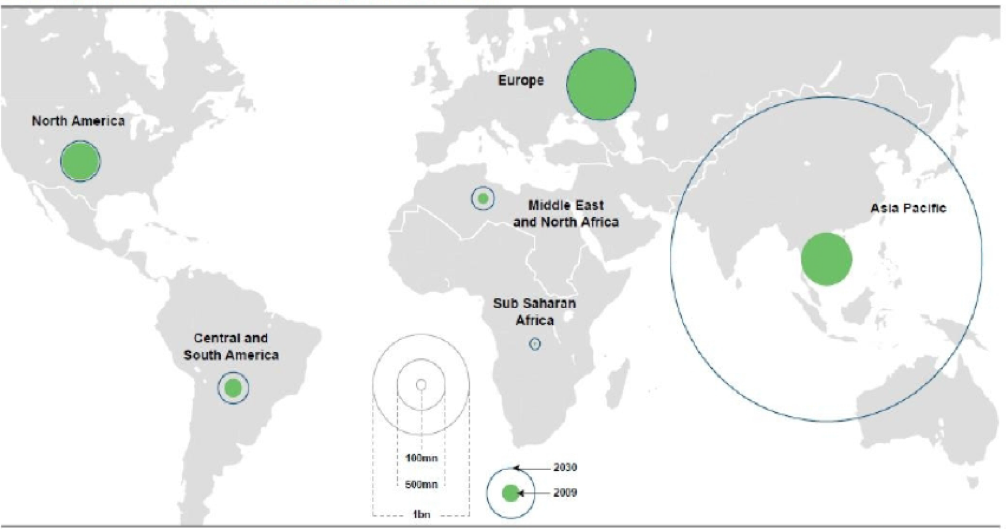
Source: OECD, Standard Chartered
The solid green circles show the size of the current middle-class populations. Around them, there is a wider blue circumference which indicates the forecast size of the middle class, by region, by 2030.
The US middle class, as you would expect, is already sizeable. The US is a mature economy. Its middle-class population is not expected to grow by any meaningful margin over the next decade or so. The same holds for Europe. Latin America, Middle East and North Africa and Sub Saharan Africa are all expected to see their middle classes grow, albeit from a tiny base.
Now look at Asia. If the OECD forecasts are correct, the size of the Asian middle class is expected to rise from roughly 500 million today to roughly 3 billion people by 2030. If this comes to pass, it will be the greatest creation of wealth in human history. There are clear implications here for how your equity portfolio should be invested.
The fund manager James Hay, who manages a Far Eastern fund called Pangolin which invests in markets like Malaysia, Indonesia, Singapore and Thailand, makes a similar point. ASEAN (the Association of Southeast Asian Nations, which comprises Brunei, Cambodia, Indonesia, Laos, Malaysia, Myanmar, the Philippines, Singapore, Thailand and Vietnam) has a consumer story with decades to run.
ASEAN alone is a region home to 670 million people, all of whom “want a house, two cars and high cholesterol just like the rest of us”. The region’s stockmarkets also have, by and large, a lower valuation than those prevalent in the developed world; these countries have higher growth prospects, and typically much lower levels of debt. These people are hungry in the best sense of the word – they are able and willing to work, and the chances are that most of them will simply work harder, and for much less pay, than their peers in the developed world.
They want to better themselves and their families, and across the region, governments are liberalising and enabling them to do precisely that. While an ageing and increasingly irrelevant West debates fussily and angrily how to divide up and consume the pie of wealth, fast emerging Asia is working on how to grow the pie instead.
In my experience, opportunities like this don’t come along too often in a lifetime. It is one thing to be able to identify a growth opportunity like Asia. It is quite another to be able to buy such a market at a meaningful discount to those valuations pertaining in the West. As Warren Buffett said,
Opportunities come infrequently. When it rains gold, put out the bucket, not the thimble.
(I eat my own cooking here. Within my own fund, the single largest country allocations are to Japan and then to Vietnam. Perhaps perversely, we’ve yet to find anything sufficiently attractive to own in the markets of either China or India, but we keep looking.)
No surprise for guessing my second chart – our old favourite, net foreign assets as a percentage of GDP.
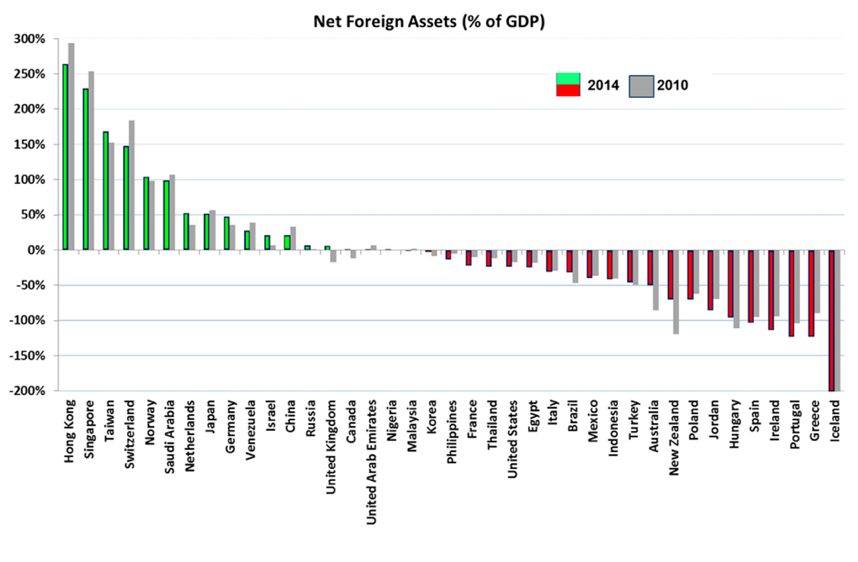
Source: IMF, EFG Wealth Management
This chart is less relevant than it has been, in that I’ve now eliminated bonds altogether from The Price Report portfolio. Nevertheless, this key metric shows how the world of debt isn’t remotely homogeneous. The world divides into winners and losers.
As a reminder, “net foreign assets” is the totality of government sector, corporate sector and household sector assets, less the value of domestic assets owned by foreign entities.
The reason it’s more useful than simply a debt-to-GDP ratio is down to the specifically risky nature of borrowings in a foreign currency. The UK government, for example, will always be able to service GBP denominated debts, because the Bank of England can simply print more sterling to do so. But the UK has also borrowed in US dollars, for example. We can’t print dollars (at least, not legally) so it’s vitally important that – in extremis – we have a source of foreign currency assets with which we can service our foreign currency debts.
Whenever countries get into difficulty in the bond markets, it’s invariably the foreign borrowings that cause the problems. Emerging economies often borrow in US dollars since it remains the benchmark global currency and is still the de facto global reserve currency (that is, the currency that central banks tend to favour for their foreign reserves). Particularly when the US dollar appreciates – as it has done so far this year – indebted foreign borrowers find it that much more expensive to service their debts. In extremis, that can mean insolvency, as Argentina and Turkey are in the process of demonstrating.
Conclusion? If you must own bonds, at least own the bonds of creditor countries that can afford to pay you back, as opposed to debtor countries who can’t. The chart above shows you the good guys and the bad guys – the good guys are the creditors, in green, and the bad guys are the net debtors, in red. It’s also reasonable to assume that, from a currency perspective, the currencies of creditor countries – where such currencies float freely – are likely to appreciate versus the currencies of debtors.
My third chart shows the long-term returns which value investing is capable of achieving.
Value of $10,000 invested across various strategies, for the 52 years ending in December 2003
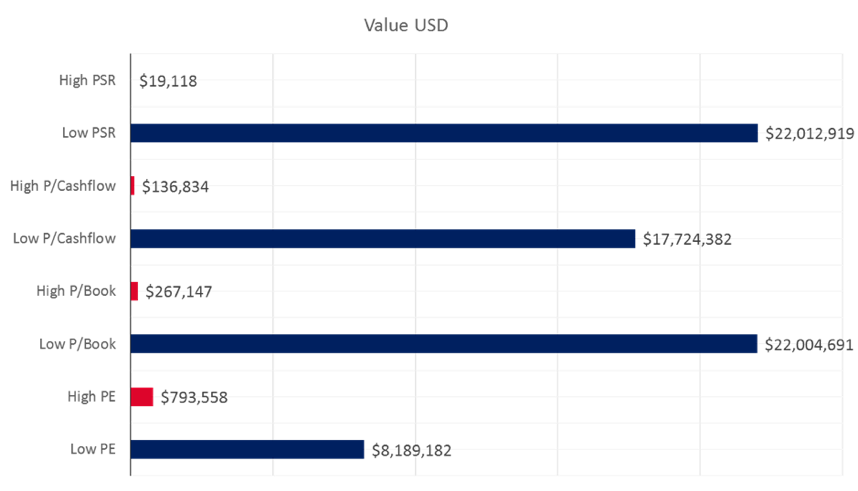
Source: James O’Shaughnessy, What Works on Wall Street
James O’Shaughnessy split the entire US stockmarket up by metric – price-to-sales ratio (PSR); price-to-cash flow; price-to-book value and price-to-earnings. He then selected the 50 stocks from the whole market that had the cheapest showing by each metric, and the 50 stocks that had the most expensive valuation by each metric. He then continually rebalanced these 50 stock holdings each year for consistency.
$10,000 invested in the “high price-to-sales ratio” (high PSR) stocks was ultimately worth $19,118. Given that’s over a period of 52 years, not much to write home about. But $10,000 invested in the lowest price/sales stocks instead ended up being worth over $22 million.
The same broadly held whether you were looking at price/cash flow, price/book or price/earnings. In each case, “value” completely wiped the floor with so-called “growth”.
The caveat here is that these are long-term returns, and there is some debate over the utility of measures like “price-to-book” in a world where so much value is held in the form of intangible corporate characteristics like branding, goodwill and intellectual property. Nevertheless, O’Shaughnessy’s message seems clear. Over the very long run, “value” investing works.
And it’s a message that I think has unusual relevance today, given the prospects for traditional markets – namely those for stocks and bonds in the West. If it ever made sense to concentrate one’s equity holdings in more conservative and defensive (ie, less highly valued) stocks, now is surely that time. And depending on one’s risk appetite and tolerance for volatility, it probably makes even more sense today to complement that equity risk with less correlated investments. The Price Report portfolio shows you some of my favourites in each case.
Beyond that, it’s just a question of behaviour – of being able to hold on for the long run, and to keep the faith…
Finally, a quick reminder:
2019 looks set to be one of the most volatile years since 2008 for private investors.
City legend Charlie Morris has just written a new guide to surviving a bear market, which contains his complete strategy to handling market collapses.
If you want to grab a free copy, you can click here to find out more. But act quick, because it’s going to be taken offline on 30 December.
Have a great weekend!

Boaz Shoshan
Editor, Capital & Conflict
Category: Economics