Have you ever had a remarkable run of luck? How did it make you feel?
Did you begin to doubt the upcoming series of gambles would go your way too? Or were you convinced of your new psychic powers?
On the flipside, people with a run of bad luck can become terribly disheartened and stop trying. Or they can recognise the unusually poor performance as something that will fix itself.
When the Israeli Air Force met the academic Daniel Kahneman, it wasn’t very impressed. He told the air force that its overzealous criticism of underperforming pilots was a mistake.
The instructors argued that every pilot who copped it from their superiors because of a mistake would subsequently do better. You can’t tell someone with years of experience reinforcing their actions that they are wrong. Especially military instructors. Especially Israelis given my airport experience.
What the air force instructors were missing was reversion to the mean.
If you make a mistake, you’re likely to fix it the next time around whether you’re getting hosed down or not. If it was unusually bad, then the “unusually” side of things offers a high probability of improvement on the next run because you return to doing what you “usually” do. A pilot who gets it right 90% of the time is very likely to improve if they miss once because of the 90%, not because their superiors are screaming in their ear.
The key questions are the average or expected level of performance (the 90%), and how widely the distribution of outcomes is around that (did the bomb miss so badly it hit the local car park).
The first is easy to understand. Air force bombers are expected to hit targets as often as possible. A 70% hit rate is better than a 50%. Improvement in the average hit rate is great news.
But it’s the second question that is more interesting – the distribution. If the air force bombers hit the target 50% of the time, but miss by miles the other 50% of the time, that’s worse than a 10% hit rate with a 70% “close enough” and a 20% miss.
The point is, you need to understand both mean and distribution, and the nature of the thing you are measuring.
Kahneman argued in favour of constant positive reinforcement instead of correcting mistakes by yelling into a microphone. Individual successes and mistakes are meaningless, it’s all about trends. That’s another story.
The z is sounding a warning
Fathom Consulting analysed financial markets using the idea of the “average” or expected price, and how far from this price our financial markets are actually priced. It’s called the z-score.
Based on the idea of mean reversion, we should be able to predict the next move – towards the mean. But first, more on the z-score.
A z-score tells you how many standard deviations a price is from the mean. A z-score is calculated using formula z = (X – μ) / σ
Looks fun, I know. z is the z-score, X is the level of the thing being measured, μ is the average of that level (the mean), and σ is the standard deviation.
Standard deviation measures the volatility of something. A small-cap stock is a lot more volatile than a blue chip. You need to take this into account when considering how far above or below the mean something is, otherwise it could be down to everyday liquidity problems instead of meaningful market information.
Plug a variety of investment asset classes into a chart of z-scores over time and you get this, from Fathom Consulting:
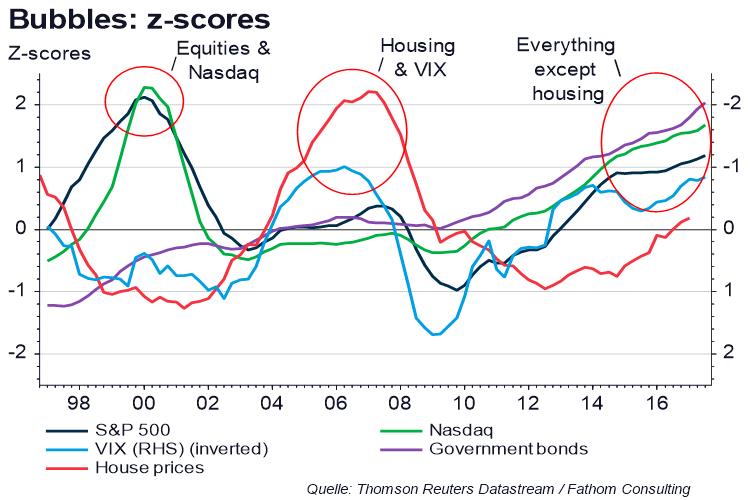
The chart measures which American asset classes have had unusual run-ups in price. They call it the “bubble z-score” because z-scores can be used in a variety of ways in finance.
In 2000, this chart would’ve warned you the American stockmarket was overvalued. In 2008, house prices were suspiciously high and volatility in the stockmarket suspiciously low (the VIX is inverted).
Today, everything except housing is suspiciously high in price. Leading the pack is government bonds. At a z-score of 2, government bonds are at a level which should be experienced just 2.5% of the time.
Just like the pilot who is likely to revert to the mean, government bond prices are likely to revert to the mean. That means a tumbling price.
What’s going on with z?
If you were an Olympics official presented with that data, you’d conclude the team is doping. They are all above average at the same time.
The logical explanation of the overpriced financial assets seems fairly simple. Central bankers don’t buy houses. At least not with central bank money.
They do buy everything else. Especially government bonds – the highest z-score. Their wealth effect has driven up stocks and depressed volatility too.
However, the chart also shows something else. Reversion to the mean might win out in the end, but it’s hardly a very powerful force in the short term. It’s behaving like gravity on the moon rather than Earth. A central banker’s nudge sends asset prices flying for quite some time.
My friend Akhil Patel sees the opposite to reversion to the mean as the real investment opportunity. He sees cycles as your chance to make impressive amounts of money. According to the last email I received from him, he’s planning on flying to Australia to put his money where his mouth is, so you have to take him seriously.
Akhil would look at that chart and point out the regularity of the ebbs and flows. Go back a little further in time and .
The key advantage of Akhil’s method is timing. Dumping all government bonds today might miss out on the juiciest market action yet – the blow-off rally. You need to know what to buy and sell, but also when. And the rally in UK stocks isn’t over yet.
A bit of recap
Long statistical lesson short, everything is overpriced except housing. Because central bankers don’t buy houses with quantitative easing (QE).
The biggest offenders of the statistical law “reversion to the mean” are government bonds. Because government bonds are on top of the list of central bank asset purchases.
So what exactly is going on in the US bond market? Why? Because every financial asset in the world is built on US Treasury bonds.
US government debt is, in theory, risk free. This means it is used in the pricing models of almost all financial assets. And these pricing models heavily influence actual market prices.
If you look up a financial pricing equation, there’s bound to be a risk-free rate – a rf – in there somewhere. That’s because everything in financial markets draws its value in relative terms. The “relative to what” is the risk-free rate, US government bonds. Economists would call it the opportunity cost of investing.
The reliance on Treasury bonds as the risk-free rate means that, if US government bonds go haywire, everything else does too. Trillions of derivatives contracts suddenly become financial weapons of mass destruction with a software bug in the guidance system.
But why would the US Treasury market go haywire? Especially with central bankers in charge?
The political wildcard
The only thing central bankers don’t seem to have control over is politicians. And they’re capable of messing with the US Treasury bond market in all sorts of creative ways.
There are two you need to worry about right now. And the data is already worrying for you.
The US Treasury yield curve tells you how bonds of different maturities are priced. Usually, investors require higher returns for longer dated bonds because there’s a higher risk of something going wrong over longer periods of time. This means the yield curve slopes upward.
But when it slopes downward, that suggests a recession is coming. Investors are looking for a safe haven in the medium term. They bid up the price and the yield goes down.
Bloomberg explains that the American yield curve is getting dangerously close to inverting. And points out “The Treasury yield curve has inverted ahead of the past six downturns going back to the 1960s, including prior to the last two recessions in 2000 and 2006.”
So is a recession bound for the US? The problem with the centuries-old indicator is that central bankers have completely distorted it with their buying of bonds. Who knows what the yield curve would look like without their trillions?
However, the US certainly has gone an unusually long time without a recession. And economic mismanagement at the political level could be the trigger.
Until next time,
Nick Hubble,
Capital & Conflict
Related Articles:
- How to profit from central bank monetary policy
- How to predict the future, with double payback
- Which central banker snaps first?
Category: Economics