Enough politics. Even if politicians and central bankers are driving stockmarkets and property markets these days, it’s time to take a look at how the financial world is faring in its own right.
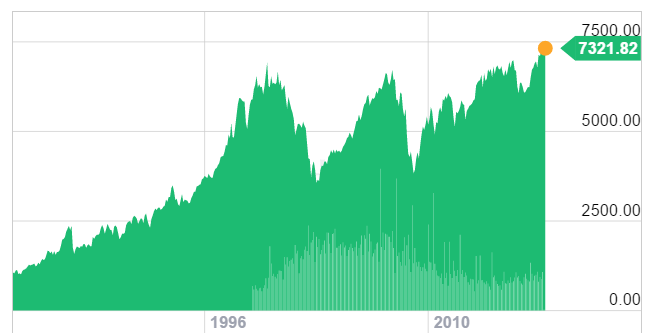
The FTSE 100 is trading above its highs of 1999. But a lot has changed since back then.
Less than half the companies in 1999’s FTSE 100 are still in the index. A bunch of banks and telecoms disappeared in 2008 and 2001. Resource companies and anyone who succeeded in selling to Asia’s booming consumer market took their place.
Which begs the question about your investment style over the last two decades. What if you had followed your financial advisor’s advice and invested in a cross section of companies in the FTSE index back in 1999? If you did, I’m sorry to bring up the painful result.
You’ve seen your telecom investments tumble and then your bank stocks tumble seven years later. It must’ve been a disaster overall. Especially compared to what you were promised – an average gain of about 5-7%.
Hopefully dividends put you ahead in the end. Then again, after almost two decades of inflation…
But academics and financial advisors still point to the FTSE index, which is making new highs above the 1999 level. “See, investing in the index works in the long run!”
But did you really make money using the index strategy? The index may be up at new highs. But if half the index is different companies to those in 1999, you’ve probably bought and sold stocks during that time. So it still depends on which stocks you bought and sold, and when.
And that’s where the index investing myth is exposed.
The companies that fail are driven out of the index. The successful companies replace them. But all this happens after the failure and success. So if you invest based on the index, you’re selling losers after they’ve become losers, and buying winners after they’ve become winners. You’re on the wrong end of the stick both times.
Worse still, each time there’s a crash, you’re exposed to it. Each time a company booms, you probably miss out on it because that company wasn’t in the index yet. Eventually it’s included into the index thanks to its success, but you already missed out on the big gains.
Index investing is similar to the famous turkey problem. A turkey might conclude it’s man’s best friend because it’s fed very well, day after day. Until Thanksgiving or Christmas.
Are you a turkey? Do you rely on the index to tell you which companies are safe because they’ve had a few good years?
Avoid imploding companies… until after they implode
Just as some farm animals mysteriously disappear on certain key festive dates, some companies have an inherent ability to implode on a regular basis.
Biotech companies that are developing a new drug, for example. These companies usually need a big pharmaceutical business to buy them out because they can’t afford to develop or market the drug they’re developing. If the research and development fails, or funding comes up short, the business is toast.
But these companies are small fry compared to banks. Thanks to their business model, banks have the ability to go from very valuable to insolvent overnight. Their assets – loans – are promises. The value of the bank is based on the probability of people keeping their promises. That can change in an instant.
Technology companies, which are a bet on the development and commercialisation of future technologies, are similar to biotech companies. But they can be massive. Like in 1999, it seems these types of companies are the ones leading the charge in stockmarkets now.
Stockmarket gains in the last decade and a half came from companies which don’t make money. Daniel Drew from dark-bid.com came up with this chart which shows how investing in unprofitable companies would’ve served you better than profitable companies between 2000 and 2015.
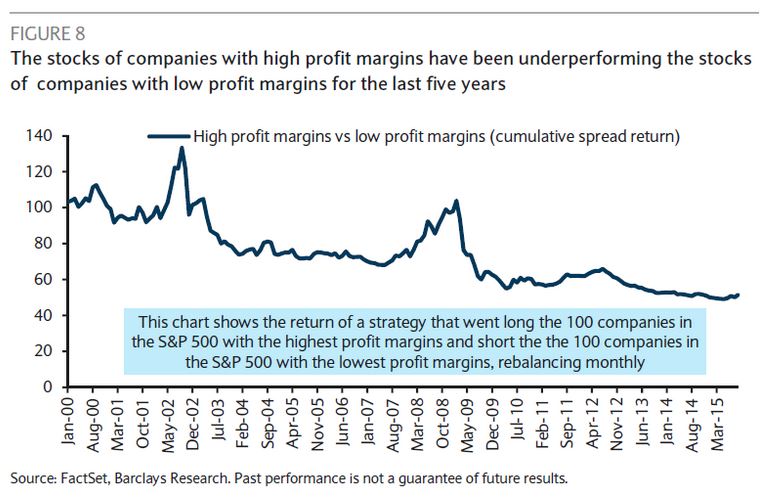
In other words, companies that are a punt on the future are keeping the market afloat. Companies that are the real deal haven’t been doing so well.
The US’ stockmarket rally is based on high-risk bets, not real gains.
Then how should you invest?
There’s lots of ways you shouldn’t invest. Tracking the academic version of the index is asking for trouble.
But what are the alternatives?
The best method is to wait for the regularly imploding companies to implode and then buy their shares. But this takes a painful amount of patience. And you have to actively buy and sell.
If you believe and understand why index investing is flawed, there’s another intriguing option. Companies that aren’t quite in the FTSE 100, but are on their way there, are a great way to take advantage of index investors.
Many funds are only allowed to invest in FTSE 100 stocks, or their overseas counterparts. Often this is because the amount of money they need to invest would overwhelm a smaller company’s stockmarket liquidity.
So if you invest in a company that enters the FTSE 100 in the next few years, you’ll suddenly find yourself owning shares that big buyers are taking an interest in.
Of course figuring out which companies will be successful enough to enter the index is hard. But at least you know where to look.
Another option is to own businesses rather than punt on them. This means investing for dividends in the same way that small business owners live off their company’s earnings. Except you don’t do any work. We have the best dividend paying companies covered for you here.
There are many other successful strategies. But what’s mystifying is how the mainstream financial services industry has ignored the lesson of the last two decades: you can’t ignore the big picture. Even two stockmarket crashes in ten years didn’t make it change its mind.
Third time lucky?
Warning signs are flashing
The famous stockmarket academic Robert Shiller isn’t the type to give you a clear warning. But his Cape is at 25 for the US stockmarket. It’s only been that high on three occasions – 1929, 1999 and 2007. Do I need to point out what followed each date?
Cape measures price-to-earnings (p/e) ratios, the price you pay per dollar of earnings. For example, a company with a stock price of five pounds and profits of one pound per year has a p/e of 5. At a Cape of 25, investors are paying 25 dollars per dollar of profits.
Either profits are going to boom or stock prices will tumble. That buying opportunity for crisis-prone stocks might be coming at last.
Until next time,
Nick Hubble,
Editor, Capital & Conflict
Category: Economics